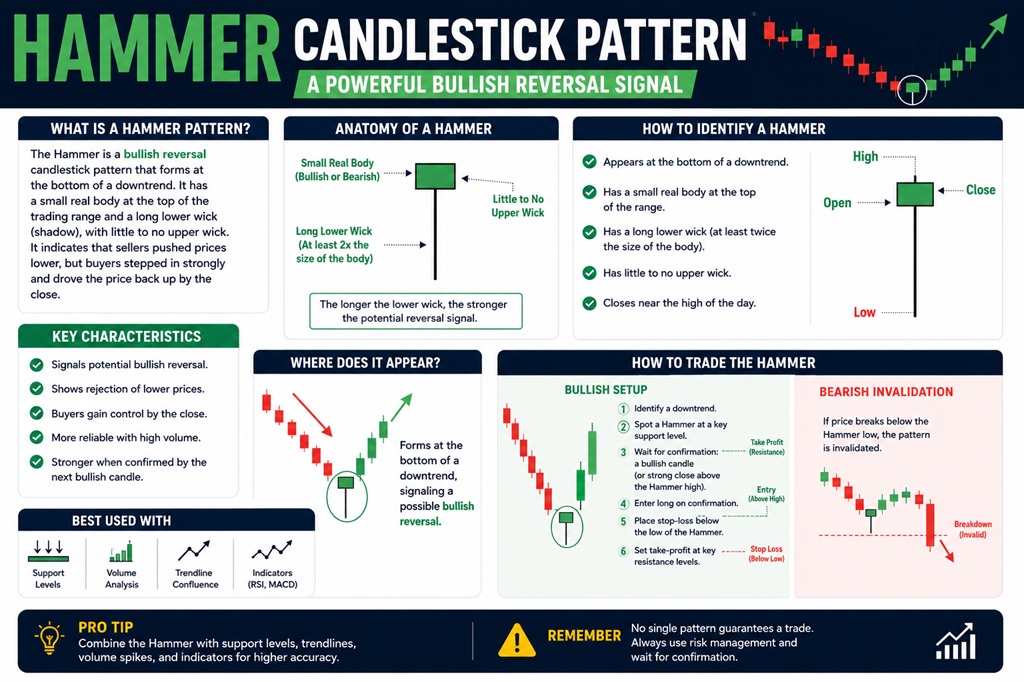
Think of a hammer candle like a small body on top and a long stick below. It really does look like a hammer.
A classic hammer:
Appears after a downtrend
Has a small body near the top of the candle
Has a long lower shadow (wick), usually at least 2 times longer than the body
Has little or no upper shadow
In simple words:
Price went down a lot in that period, but buyers came back strongly and pushed it up near the open. That’s why the body is on top and the lower wick is long.
Basic hammer shape:
Imagine a small rectangle near the top (the body). From the bottom of that rectangle, a long thin line goes straight down (the lower wick). On top of the body, there is either no line or a tiny line. Label it like this:
Top of wick/body: “High / Open / Close area”
Bottom of long line: “Low – where sellers pushed price down”
Final body near top: “Buyers pushed price back up”
You can draw this yourself as a simple diagram.
The story behind a hammer (market psychology)
To really understand the hammer, forget formulas and think like this:
Market is already falling (downtrend). Sellers are in control.
A new candle starts.
Sellers again push the price down strongly. It looks like another bearish day.
At some point, buyers say, “Enough, price is too cheap now.”
Buyers enter with force and push the price back up near the open.
Candle closes near the high and leaves a long tail below.
So this one candle tells a story:
Sellers tried to continue the downtrend.
Buyers fought back and won that battle within that candle.
The long lower shadow is like a mark of sellers’ failure.
Because of this, the hammer is often seen as a bullish reversal signal – a possible sign that the downtrend might end or at least pause.
But remember: it is a signal, not a guarantee.
How to recognize a real hammer (rules you can use)
When you look at a chart, not every candle with a small body and a tail is a “proper” hammer. Set some basic rules for yourself:
Location in trend
It should come after a decline or near the bottom of a move.
A hammer in the middle of an uptrend is usually not a hammer pattern; it might be a “hanging man” or just noise.
Lower wick length
The lower wick should be at least 2 times the size of the body.
The longer the lower wick, the stronger the rejection of lower prices.
Upper wick
Very small or no upper wick is ideal.
If there is a big upper wick, the signal is weaker or it may be some other pattern.
Body position
The body must be near the top of the candle.
If the body is in the center, it’s more like a spinning top or doji, not a hammer.
Body colour
It can be green or red.
Many traders prefer a green hammer (close above open) as slightly more bullish, but even a red hammer can be meaningful if the structure and context are good.
Hammer vs. other similar patterns
There are a few patterns that look like hammer or are related. It’s important to separate them in your mind.
4.1 Hammer (bullish, at bottom)
Appears after a downtrend
Signals possible bullish reversal
Long lower wick, small body on top
4.2 Hanging man (bearish, at top)
Same shape as a hammer, but:
Appears after an uptrend, near the top
In that context, it’s a warning that buyers may be getting weak
Often called a bearish reversal signal
So: Same shape, opposite meaning, depending on where it appears.
4.3 Inverted hammer (bullish)
Small body at the bottom, long upper wick, little or no lower wick
Appears after a downtrend
Shows that buyers tried to push price up but sellers pushed it back a bit
It can still signal a possible bullish reversal, especially if next candle confirms it
4.4 Shooting star (bearish)
Same shape as inverted hammer
Appears after an uptrend, near the top
Bearish meaning: buyers pushed up and failed; sellers smacked the price down
So the trend and location decide whether you call it hammer / hanging man / inverted hammer / shooting star.
Where a hammer really matters (context)
A hammer is powerful only in the right place. Think like this:
5.1 Hammer at support
Imagine price is falling towards a support zone (a level where price bounced before).
At that support level, you see a hammer:
Long lower wick pierces below support but closes back above it.
That means sellers tried breaking support, but buyers defended and brought it back.
This combination (support + hammer) is much stronger than a random hammer in the middle of nowhere.
5.2 Hammer after a sharp fall
If there’s a strong, fast decline and then suddenly a hammer forms, it can be a sign of:
Panic selling at the low
Smart money or aggressive buyers stepping in
Again, you want to see what the next candle does.
Confirmation: Don’t trust one candle blindly
One candle alone is like one line of a story. Better to read the next line.
After a hammer, traders often look for confirmation:
A bullish candle right after the hammer, closing above the hammer’s high
Price holding above the low of the hammer
Volume increase (optional, but it adds strength)
A simple confirmation rule many traders use:
Entry idea:
Wait for the next candle to break above the high of the hammer, then consider going long.
Stop loss idea:
Place a stop a bit below the low of the hammer. If that low breaks, the pattern has failed.
Target idea:
Aim for the next resistance level, or use a risk:reward ratio like 1:2 or 1:3.
This keeps your logic clear and your risk defined.
Step‑by‑step example
Let’s visualize a simple scenario.
Stock is falling from 200 to 150 over many candles.
Price hits a previous support zone around 150.
One day, a candle opens at 150, falls to 140 during the day, but then buyers push it back up, and it closes at 151.
The candle looks like:
Open: 150
Low: 140
Close: 151
Very small or no upper wick
That candle is a hammer:
Body near 150–151 (on top)
Long lower wick from 150 down to 140
Appears after a downtrend, at a support zone
Next day:
Price opens around 151 and moves up to 157, closing strong green.
Now you have:
Hammer at support
Confirmation candle moving up
This is the kind of textbook situation where traders might enter a long, with stop under 140 and target some higher resistance
Hammer on different time frames
Hammer works on many time frames:
5‑minute or 15‑minute charts (intraday traders)
1‑hour or 4‑hour charts (swing traders)
Daily or weekly charts (position traders, investors)
Important points:
On very small time frames (1‑min, 3‑min), you will see many hammer‑like candles which can be just noise.
On higher time frames (daily, weekly), hammers are fewer but usually more meaningful.
If you’re new, it’s usually better to learn on higher time frames first, because:
Less noise
cleaner patterns
easier to manage trades
Common mistakes with hammer candles
Let’s talk about things that trap a lot of beginners.
Mistake 1: Calling every long‑wick candle a hammer
Not every candle with a tail is a hammer. If:
Body is in the middle
Shadows are almost equal
Trend context is missing
…it is not a clean hammer. Be strict with your pattern rules.
Mistake 2: Ignoring the trend
A hammer is meant as a bullish reversal after a decline.
If you see it in an uptrend and treat it as a buy signal, you are mixing patterns. In an uptrend, the same shape near the top could be a hanging man, not a hammer.
Mistake 3: Entering without confirmation
Jumping in the moment you see a hammer can be risky. Sometimes:
The next candle goes straight down and breaks the hammer low.
That means the pattern failed and sellers are still strong.
Waiting for a close above the hammer high is often safer, though you might miss a bit of the move. That’s the trade‑off between safety and early entry.
Simple hammer trading framework (for your notes or blog)
You can turn all this into a clear, human checklist like this:
Trend:
Is price clearly in a downtrend on my time frame?
Location:
Is the hammer near a support level, demand zone, or a major low?
Candle shape:
Small body near top
Long lower wick (≥ 2x body)
Very small or no upper wick
Confirmation:
Next candle breaks above hammer high?
Close bullish?
Risk management:
Stop loss below hammer low
Position size small enough so that loss is acceptable
Target at next resistance or use fixed risk:reward
If any of these points is missing, you treat the setup more carefully.
How to practice identifying hammer patterns
If you really want to build skill (not just theory), here’s a good exercise:
Open daily charts of a few stocks, indices, forex pairs, or crypto.
Scroll back in history and mark every clear hammer you see after a downtrend.
For each one, note:
What happened in the next 5–10 candles?
Did price reverse, go sideways, or continue down?
Was there support nearby?
Keep a simple record: maybe a notebook or spreadsheet with screenshots.
After looking at 50–100 hammers, you will naturally start to “feel” which ones are good quality and which ones are risky.
Conclusion
To wrap up everything about the hammer candlestick, think of it like this:
A hammer is simply the story of sellers losing control and buyers fighting back at the lows. It has a small body on top, a long lower shadow, and it shows up after a downtrend. On its own, it is not magic. It is a signal of rejection of lower prices, a hint that the down move might be getting tired and that buyers are finally interested again.
Used properly, the hammer is powerful only when you respect context and confirmation. The best hammers form near support zones or important lows, fit the proper shape (long lower wick, body near top), and are followed by a bullish confirmation candle. When you add clear entry rules, stop loss below the hammer low, realistic targets, and position sizing, the pattern becomes part of a solid trading plan, not just a random symbol on the chart.
If you treat the hammer as one piece of a bigger puzzle – along with trend, levels, volume, and risk management – it can help you read the market’s mood with much more confidence and stay on the right side of major turns.
What part of the hammer pattern still feels a bit confusing to you: the shape, the psychology behind it, or how to actually trade it with entries and stops?
Gaurav Heera is a seasoned Finance and Stock Market Expert with extensive experience in market education, investing, and trading. Through Asset Scholars, he shares practical knowledge and actionable insights to help individuals understand financial markets, build investment skills, and make informed wealth-creation decisions.