Introduction to Candlestick Patterns
If you have ever opened a stock chart, you have probably seen red and green candles moving up and down. These candles are known as candlesticks, and they form one of the most important tools in technical analysis.
Candlestick patterns help traders understand what buyers and sellers are doing in the market. Instead of looking at complicated formulas, traders can simply observe candle formations to estimate whether prices may move up, move down, or continue their current trend.
The beauty of candlestick patterns is their simplicity. Even a beginner can learn them quickly, while professional traders use them every day to make trading decisions.
Tip: Candlestick patterns should never be used alone. They work best when combined with support and resistance levels, trend analysis, and volume.
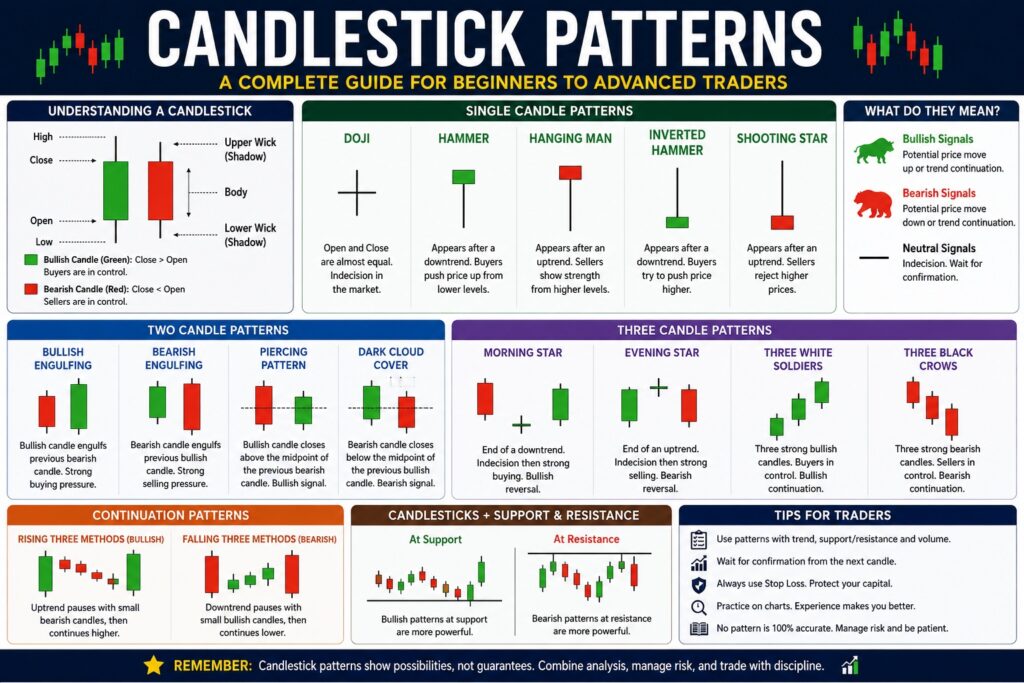
What Is a Candlestick?
A candlestick represents price movement during a specific time period.
For example:
- On a 5-minute chart, one candle represents 5 minutes.
- On a 1-hour chart, one candle represents 1 hour.
- On a daily chart, one candle represents one trading day.
Every candlestick contains four important prices:
- Open Price
- High Price
- Low Price
- Close Price
These four values tell the complete story of market activity during that period.
Understanding Candlestick Structure
A candlestick consists of two parts:
Body
The body shows the difference between opening and closing prices.
Wick (Shadow)
The thin lines above and below the body are called wicks or shadows.
They show how far price moved before returning.
Green Candle
A green candle means buyers were stronger.
Close Price > Open Price
Red Candle
A red candle means sellers were stronger.
Close Price < Open Price
Tip: The larger the body, the stronger the buying or selling pressure.
Why Candlestick Patterns Matter
Candlestick patterns help traders:
- Identify market sentiment
- Spot trend reversals
- Confirm trend continuation
- Find entry opportunities
- Manage risk effectively
Think of candlesticks as the language of the market.
Every candle tells a story about the battle between buyers and sellers.
Single Candlestick Patterns
Single candlestick patterns are formed using only one candle.
Doji Pattern
A Doji forms when opening and closing prices are almost equal.
The body becomes very small.
It indicates market indecision.
Neither buyers nor sellers are in complete control.
Types of Doji
- Standard Doji
- Long-Legged Doji
- Dragonfly Doji
- Gravestone Doji
Trading Interpretation
After a strong uptrend:
- Possible reversal downward
After a strong downtrend:
- Possible reversal upward
Tip: Never trade a Doji alone. Wait for confirmation from the next candle.
Hammer Pattern
The Hammer appears after a downtrend.
Characteristics:
- Small body
- Long lower wick
- Little or no upper wick
Meaning
Sellers pushed prices lower.
Buyers entered aggressively and pushed prices back up.
This shows buyer strength.
Signal
Potential bullish reversal.
Hanging Man Pattern
The Hanging Man looks exactly like a Hammer.
The difference is location.
It appears after an uptrend.
Meaning
Although buyers managed to close the candle higher, sellers showed strength during the session.
This may indicate a coming reversal.
Signal
Potential bearish reversal.
Inverted Hammer
The Inverted Hammer appears after a downtrend.
Characteristics:
- Small body
- Long upper wick
- Small lower wick
Meaning
Buyers attempted to take control.
Although sellers pushed prices back, buying interest became visible.
Signal
Bullish reversal possibility.
Shooting Star
The Shooting Star appears after an uptrend.
Characteristics:
- Small body
- Long upper wick
- Little lower wick
Meaning
Buyers tried pushing prices higher.
Sellers entered strongly and rejected higher prices.
Signal
Potential bearish reversal.
Double Candlestick Patterns
These patterns use two candles.
Bullish Engulfing Pattern
This is one of the strongest bullish reversal patterns.
Formation
- First candle is bearish.
- Second candle is bullish.
- Second candle completely covers the first candle’s body.
Meaning
Buyers have overwhelmed sellers.
Market sentiment may be changing.
Signal
Bullish reversal.
Tip: The pattern becomes stronger near support zones.
Bearish Engulfing Pattern
Opposite of Bullish Engulfing.
Formation
- First candle bullish
- Second candle bearish
- Second candle fully engulfs first candle
Meaning
Sellers have gained control.
Signal
Bearish reversal.
Piercing Pattern
Appears after a downtrend.
Formation
- First candle bearish
- Second candle bullish
- Bullish candle closes above the midpoint of previous candle
Meaning
Buying pressure is increasing.
Signal
Bullish reversal.
Dark Cloud Cover
Appears after an uptrend.
Formation
- First candle bullish
- Second candle bearish
- Second candle closes below midpoint of first candle
Meaning
Selling pressure is increasing.
Signal
Bearish reversal.
Triple Candlestick Patterns
These patterns involve three candles.
Morning Star
One of the most reliable bullish reversal patterns.
Formation
- Large bearish candle
- Small indecision candle
- Strong bullish candle
Meaning
Sellers dominated initially.
Market became uncertain.
Buyers finally gained control.
Signal
Strong bullish reversal.
Evening Star
Opposite of Morning Star.
Formation
- Strong bullish candle
- Small indecision candle
- Strong bearish candle
Meaning
Buyers are losing control.
Sellers are entering aggressively.
Signal
Bearish reversal.
Three White Soldiers
A powerful bullish pattern.
Formation
Three consecutive bullish candles.
Each candle closes higher than the previous one.
Meaning
Strong buyer dominance.
Signal
Bullish trend continuation or reversal.
Three Black Crows
Opposite of Three White Soldiers.
Formation
Three consecutive bearish candles.
Meaning
Strong selling pressure.
Signal
Bearish trend continuation or reversal.
Continuation Candlestick Patterns
Not all patterns indicate reversals.
Some indicate trend continuation.
Rising Three Methods
Appears during an uptrend.
Formation
- One large bullish candle
- Few small bearish candles
- Another strong bullish candle
Meaning
Temporary profit booking.
Trend remains strong.
Signal
Bullish continuation.
Falling Three Methods
Appears during a downtrend.
Formation
- Large bearish candle
- Small bullish candles
- Another strong bearish candle
Meaning
Temporary buying activity.
Downtrend remains intact.
Signal
Bearish continuation.
Candlestick Patterns with Volume
Volume can greatly improve pattern reliability.
For example:
Bullish Engulfing + High Volume
Very strong buying interest.
Bearish Engulfing + High Volume
Strong seller participation.
Hammer + High Volume
Often indicates institutional buying.
Tip: Volume acts like a confirmation tool for candlestick patterns.
Candlestick Patterns and Support Resistance
The same pattern can have different outcomes depending on location.
Example 1
Hammer in the middle of nowhere.
Weak signal.
Example 2
Hammer at a strong support level.
Strong signal.
This is why professional traders always focus on context.
Common Mistakes Traders Make
Trading Every Pattern
Not every pattern deserves a trade.
Quality matters more than quantity.
Ignoring Trend Direction
A bullish pattern in a strong downtrend may fail.
Always check trend direction.
Ignoring Volume
Volume helps confirm market participation.
Without volume, many patterns become unreliable.
Entering Too Early
Wait for confirmation candles.
Patience improves accuracy.
Risking Too Much
Even the strongest patterns fail sometimes.
Always use stop losses.
Tip: Successful trading is more about risk management than finding perfect patterns.
How Professional Traders Use Candlestick Patterns
Professional traders rarely buy or sell simply because they see a pattern. Technical analysis and trade execution is much more than that.
Instead, they combine:
- Market structure
- Trend analysis
- Support and resistance
- Volume
- Risk management
- Candlestick confirmation
A Hammer at support with increasing volume is far more valuable than a Hammer appearing randomly on a chart.
Best Candlestick Patterns for Beginners
If you are new to trading, focus only on:
- Hammer
- Shooting Star
- Bullish Engulfing
- Bearish Engulfing
- Morning Star
- Evening Star
- Doji
Master these patterns first.
Most profitable trading opportunities can be identified using these seven patterns alone.
Real Market Example
Imagine a stock falling for several days.
The price reaches an important support zone.
A Hammer candle forms.
Volume increases significantly.
The next candle closes above the Hammer’s high.
This sequence tells us:
- Sellers tried pushing lower.
- Buyers defended support.
- Volume confirms buying interest.
- Next candle confirms reversal.
This setup is much stronger than simply buying because a Hammer appeared.
Candlestick Patterns vs Indicators
Many beginners ask:
“Should I use candlestick patterns or indicators?”
The answer is both.
Candlestick patterns show current market behavior.
Indicators help confirm trends and momentum.
The best traders combine:
- Candlestick patterns
- Moving averages
- RSI
- Volume
- Support and resistance
Together they provide stronger trading decisions.
Conclusion
Candlestick patterns are one of the easiest and most powerful tools in technical analysis. They help traders understand the ongoing battle between buyers and sellers and provide valuable clues about future price movements in the stock markets.
However, no candlestick pattern guarantees success. The real power comes from combining candlestick patterns with trend analysis, support and resistance, volume, and proper risk management.
For beginners, start with simple patterns like Hammer, Doji, Bullish Engulfing, Bearish Engulfing, Morning Star, and Evening Star. Practice identifying them on real charts before risking actual money.
The goal is not to memorize hundreds of patterns. The goal is to understand the story each candle tells. Once you learn to read that story, charts become much easier to understand and trading decisions become far more logical.

Gaurav Heera is a seasoned Finance and Stock Market Expert with extensive experience in market education, investing, and trading. Through Asset Scholars, he shares practical knowledge and actionable insights to help individuals understand financial markets, build investment skills, and make informed wealth-creation decisions.


