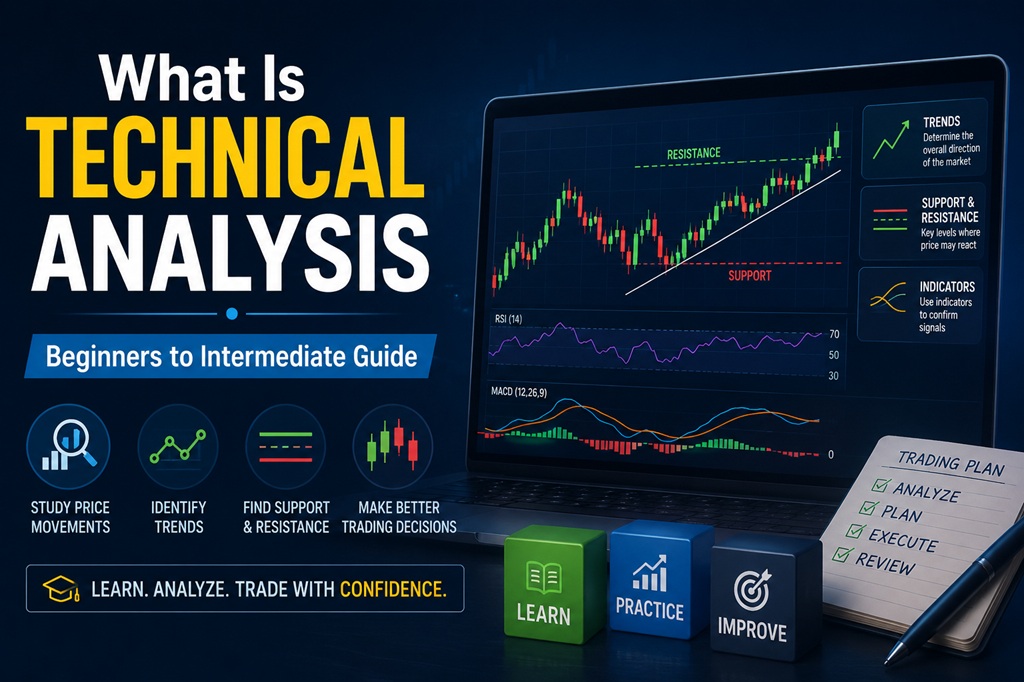
1. What Is Technical Analysis?
Technical analysis is the practice of studying price charts to estimate where the market might move next. Instead of starting with company results, news, or economic reports, it begins with:
-
Price
-
Volume (how much was traded)
-
Time
The idea is simple: by looking at how price behaved in the past, a trader tries to understand current market mood (bullish or bearish) and the probability of future moves.
In one line:
Technical analysis = reading charts to improve your timing for buying and selling.
2. Why Use Technical Analysis?
Traders use technical analysis because markets often show:
-
Trends (up, down, sideways)
-
Patterns (repeating shapes on charts)
-
Psychology (fear and greed) visible in price
Some common goals:
-
Find better entry and exit points.
-
Ride trends rather than fight them.
-
Avoid buying at obvious tops or selling at obvious bottoms.
-
Control risk with stop-loss levels.
Fundamental analysis helps decide what to buy.
Technical analysis helps decide when to buy or sell.
3. Core Principles of Technical Analysis
Most of technical analysis rests on three basic ideas:
-
Price discounts everything
Most known information (results, news, expectations) is already reflected in the price. So if you study the price, you indirectly study all that information. -
Price moves in trends
Price tends to move in one direction for a while: uptrend, downtrend, or sideways. It doesn’t change direction randomly every second on higher timeframes. -
History tends to repeat
Human emotions repeat – greed, fear, panic, FOMO. Because of that, similar chart patterns appear again and again, and traders try to use them as clues.
These are not laws, but they provide a useful framework.
4. Types of Charts
Technical analysis starts with charts. Common chart types:
-
Line chart
Plots closing prices with a line. Clean and simple, good for a quick overview. -
Bar chart
Shows open, high, low, close as vertical bars with small horizontal ticks. -
Candlestick chart (most popular)
Each “candle” usually shows:-
Open price
-
High price
-
Low price
-
Close price
-
If the close is higher than the open, the candle is often green (bullish). If the close is lower than the open, it is often red (bearish). Candlesticks make it easy to see who is winning: buyers or sellers.
Most traders from beginner to advanced prefer candlestick charts.
5. Timeframes: Different Views of the Same Market
The same stock can look bullish on one timeframe and bearish on another. That’s why timeframe matters.
Common timeframes:
-
Intraday: 1 min, 5 min, 15 min, 1 hour
-
Swing trading: 2 hour, 4 hour, daily
-
Positional / investing: daily, weekly, monthly
General idea:
-
Lower timeframes = more noise, more trades, more stress.
-
Higher timeframes = smoother moves, stronger signals, fewer trades.
A solid approach for many traders:
-
Use higher timeframe (daily, weekly) to understand the main trend.
-
Use a lower timeframe (hourly, 15 min) to fine-tune entries and exits.
6. Understanding Trend
Trend is one of the most important concepts.
Three basic trends:
-
Uptrend: price makes higher highs and higher lows.
-
Downtrend: price makes lower highs and lower lows.
-
Sideways / Range: price moves between a high zone and a low zone without a clear direction.
Simple rules:
-
In an uptrend: look more for buying opportunities (buy on dips).
-
In a downtrend: look more for selling opportunities (sell on rallies).
-
In a range: consider trading the boundaries (buy near support, sell near resistance) or stay out.
Fighting a strong trend is one of the most expensive mistakes traders make in stock markets.
7. Support and Resistance
Support: A price area where the asset tends to stop falling and often bounces up. Think of it as a “floor”.
Resistance: A price area where the asset tends to stop rising and often falls down. Think of it as a “ceiling”.
Key points:
-
Support and resistance are often zones, not exact lines.
-
When price breaks above resistance and stays above, that resistance can become new support.
-
When price breaks below support and stays below, that support can become new resistance.
Many setups revolve around how price behaves around these zones:
-
Bounce from support
-
Rejection from resistance
-
Breakouts through resistance
-
Breakdowns through support
8. Volume: Strength Behind the Move
Volume shows how much was traded. It helps answer: “How strong is this move?”
General guidelines:
-
Big move with high volume = more reliable (strong participation).
-
Big move with low volume = weaker, may reverse.
-
Breakouts above resistance with high volume are usually more trustworthy.
-
Sharp falls on huge volume can show panic selling.
Price tells you direction, volume hints at conviction.
9. Indicators: Helpful Tools (Not Magic)
Indicators are mathematical calculations based on price and/or volume. They help summarize information visually.
9.1 Moving Averages
A moving average (MA) is the average price over a certain number of periods. Common:
-
20-period (short-term)
-
50-period (medium-term)
-
200-period (long-term)
Uses:
-
If price is above the 200-day MA, many traders consider the long-term structure bullish.
-
If price is below the 200-day MA, the structure may be bearish.
-
Moving averages can act as dynamic support or resistance.
-
Crossovers (for example, 50-day MA crossing above 200-day MA) can signal trend changes.
9.2 RSI (Relative Strength Index)
RSI is an oscillator that moves between 0 and 100.
Common interpretation:
-
Above 70: “overbought” (price has risen quickly, may cool a bit).
-
Below 30: “oversold” (price has fallen quickly, may bounce).
Important: Overbought does not mean “must fall now”, especially in strong uptrends. It simply suggests strong bullish momentum.
9.3 MACD
MACD (Moving Average Convergence Divergence) uses moving averages to measure momentum and trend changes.
Basic signals:
-
Bullish when MACD line crosses above the signal line.
-
Bearish when MACD line crosses below the signal line.
-
Divergence (price making new highs, MACD not making new highs) can warn of weakening trend.
Remember: indicators confirm or clarify what price already suggests. They should not completely replace price action.
10. Candlestick Patterns: Reading Market Psychology
Candlesticks show the battle between buyers and sellers. Some basic patterns:
Single-candle patterns:
-
Doji: open and close are very close – indecision.
-
Hammer (usually at bottom): long lower shadow, small body near top – sellers pushed price down, but buyers pulled it back up (potential bullish reversal).
-
Shooting star (usually at top): long upper shadow, small body near bottom – buyers pushed price up, but sellers pulled it back down (potential bearish reversal).
Multi-candle patterns:
-
Bullish engulfing
-
Bearish engulfing
-
Morning star
-
Evening star
Patterns are stronger when:
-
They appear near strong support or resistance.
-
They align with the higher timeframe trend.
-
Volume supports the move.
11. Chart Patterns: Shapes Over Time
Over many candles, price can form recognizable shapes:
-
Double top
Price tests a high twice and fails both times → potential bearish reversal. -
Double bottom
Price tests a low twice and holds → potential bullish reversal. -
Head and shoulders
Three peaks, middle one highest → often a topping pattern. -
Inverse head and shoulders
Three lows, middle one lowest → often a bottoming pattern. -
Triangles (ascending, descending, symmetrical)
Periods of consolidation before a breakout. -
Flags and pennants
Short pauses in a strong trend; often the trend continues after the pattern.
These patterns give probabilities, not guarantees. Confirmation from volume and price action is very important.
12. A Simple Trading Process Using Technical Analysis
Here’s a clean, beginner-to-intermediate process:
-
Choose your timeframe
Decide if you are intraday, swing, or positional. -
Check the trend on a higher timeframe
-
Look for higher highs/lows or lower highs/lows.
-
Use a moving average (like 50 or 200) as a guide.
-
-
Mark key support and resistance levels
Use previous swing highs/lows, gap areas, and price zones where price reversed multiple times. -
Watch how price behaves around these zones
-
Look for candlestick signals (hammers, engulfing, etc.).
-
Look for chart patterns (double top/bottom, triangles, etc.).
-
-
Check volume
Confirm whether the breakout or rejection has strong participation. -
Use indicators for confirmation, not for blind signals
For example:-
RSI to see if the move is stretched.
-
MACD to check momentum.
-
-
Plan your trade before entering
-
Define entry level.
-
Set stop-loss (where your idea is invalid).
-
Set target or trailing plan.
-
-
Manage risk
-
Risk only a small percentage of your capital per trade.
-
Do not move stop-loss away in hope.
-
Keep position sizing consistent and disciplined.
-
13. Common Beginner Mistakes
Some mistakes that many traders make in the beginning:
-
Trading without a stop-loss.
-
Using too many indicators at the same time.
-
Ignoring the higher timeframe trend.
-
Overtrading out of boredom or FOMO.
-
Averaging down blindly in a strong downtrend.
-
Risking too much on one trade.
-
Expecting any strategy to be right 100% of the time.
Technical analysis is about probabilities, not certainty. Risk management is as important as analysis.
14. Technical vs Fundamental: How They Fit Together
-
Fundamental analysis:
-
Focuses on business, earnings, growth, valuation.
-
Mainly used to select quality stocks or assets for the long term.
-
-
Technical analysis:
-
Focuses on price charts, volume, patterns, and timing.
-
Mainly used to time entries and exits and manage trades.
-
Many traders and investors combine both:
-
Use fundamentals to decide what is worth buying.
-
Use technicals to decide when to buy and when to exit.
15. How to Practically Start Learning
For a beginner aiming to grow to intermediate level:
-
Focus on a few instruments (for example, an index and 3–5 stocks).
-
Start with daily candles and simple charts (no indicators at first).
-
Practice identifying:
-
Trend
-
Support and resistance
-
Basic candlestick patterns
-
-
Keep a trading journal:
-
Screenshot charts.
-
Write what you think will happen and why.
-
Review later and learn from the outcome.
-
-
Add simple indicators like moving averages and RSI after you are comfortable with raw price.
-
Start with paper trading or very small amounts.
-
Review your trades regularly and refine your rules.
To move you from beginner toward intermediate, the next step is usually to focus deeply on one area (for example, support–resistance plus candlestick patterns, or moving averages plus trend trading).

Gaurav Heera is a seasoned Finance and Stock Market Expert with extensive experience in market education, investing, and trading. Through Asset Scholars, he shares practical knowledge and actionable insights to help individuals understand financial markets, build investment skills, and make informed wealth-creation decisions.


