Introduction
Candlestick patterns are among the most powerful tools used in technical analysis. They help traders understand the ongoing battle between buyers and sellers and provide clues about possible future price movements.
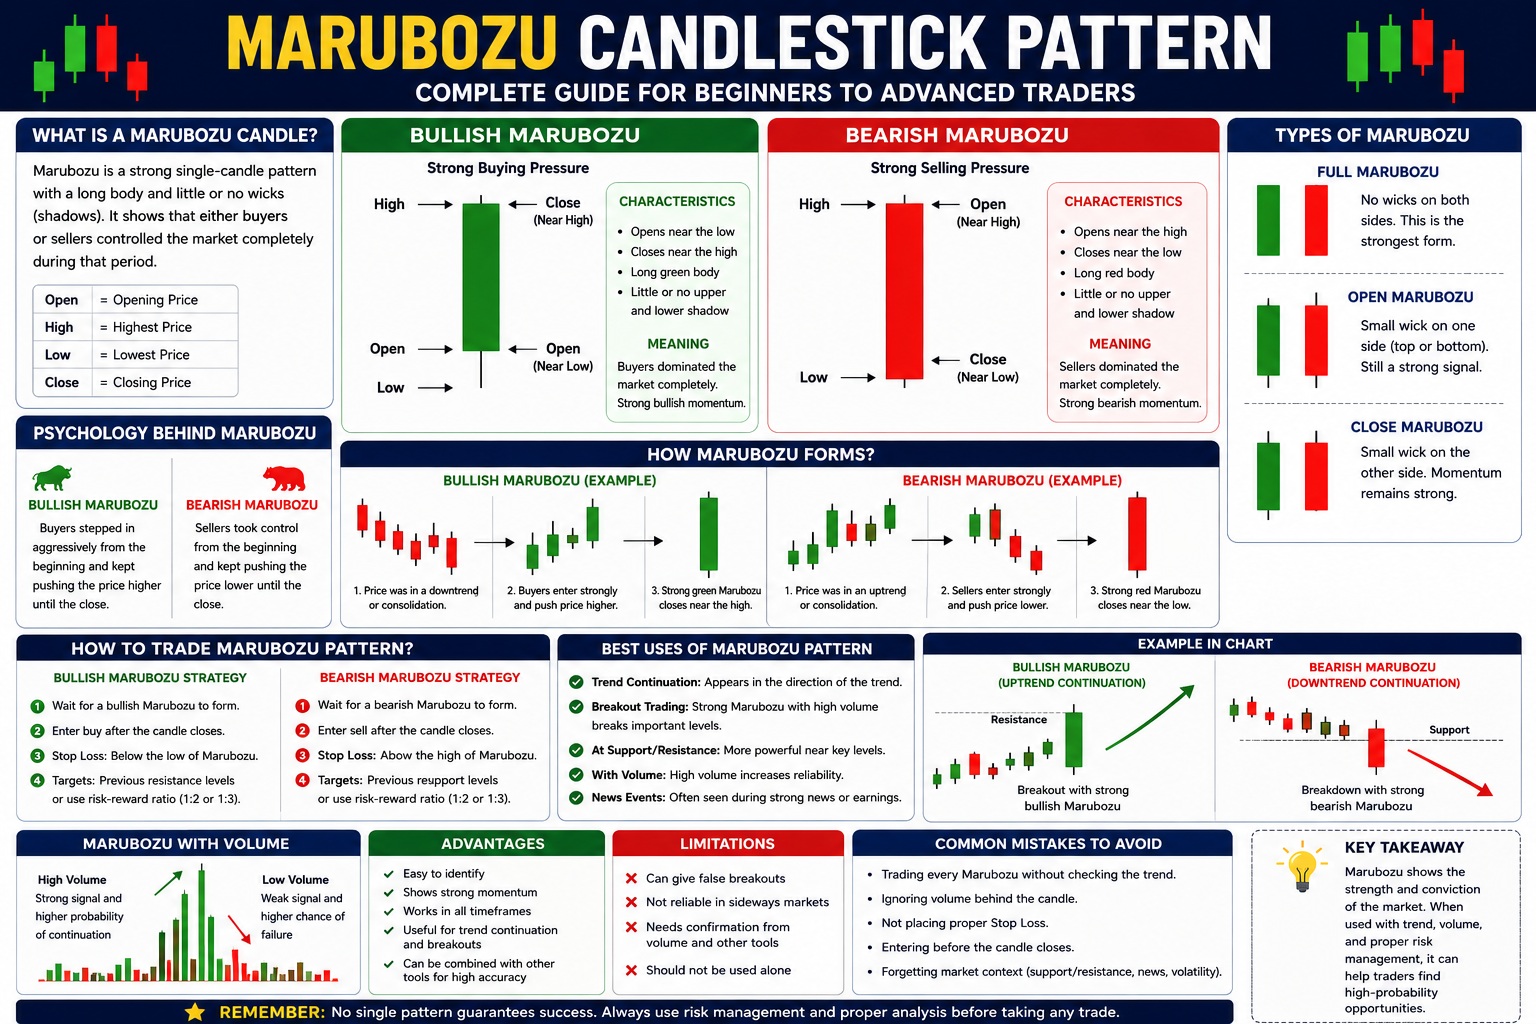
Among all candlestick patterns, the Marubozu Candlestick Pattern is one of the simplest yet most powerful patterns. The word “Marubozu” comes from Japanese charting techniques and roughly means “bald” or “shaved head,” indicating a candle with little or no wick on either side.
A Marubozu candle represents strong conviction from either buyers or sellers. When such a candle appears on a chart, it often indicates that one side completely dominated the market during that trading period.
In this guide, we’ll explore everything about the Marubozu pattern, including its formation, psychology, types, advantages, limitations, trading strategies, and real-world applications.
What Is a Marubozu Candlestick Pattern?
A Marubozu candlestick patterns is a candle with a long body and very small or no upper and lower shadows (wicks).
Unlike many other candlestick patterns that indicate indecision, a Marubozu candle signals decisive action from buyers or sellers.
The candle opens near one extreme and closes near the other extreme.
This tells us that one side controlled the market almost entirely during that period.
Why Is the Marubozu Pattern Important?
Many traders focus heavily on complicated indicators and forget that price itself is the most important source of information in technial analysis.
A Marubozu candle reveals:
- Strong market sentiment
- High momentum
- Aggressive buying or selling
- Potential trend continuation
- Potential breakout opportunities
When a Marubozu appears, it often attracts the attention of traders, institutions, and algorithms.
Understanding the Structure of a Marubozu Candle
Every candlestick consists of:
- Open Price
- High Price
- Low Price
- Close Price
In a typical candle, buyers and sellers push prices in different directions, creating wicks.
In a Marubozu candle:
- Wicks are very small or absent.
- The body is significantly larger than surrounding candles.
- Price moves strongly in one direction.
This indicates strong conviction from market participants.
Types of Marubozu Candlestick Patterns
There are two major types:
Bullish Marubozu
A Bullish Marubozu is a large green candle with little or no shadows.
Characteristics
- Opens near the low
- Closes near the high
- Large bullish body
- Very small or no wicks
Meaning
Buyers dominated the entire session.
Sellers had almost no control.
The market continuously moved upward.
Market Psychology
Imagine a stock opening at ₹100.
Throughout the day, buyers continue purchasing aggressively.
The stock closes near ₹110.
At no point do sellers manage to push prices significantly lower.
This shows strong confidence from buyers.
Bearish Marubozu
A Bearish Marubozu is a large red candle with little or no shadows.
Characteristics
- Opens near the high
- Closes near the low
- Large bearish body
- Very small or no wicks
Meaning
Sellers dominated the market.
Buyers were unable to create meaningful upward movement.
Market Psychology
Imagine a stock opening at ₹500.
Selling pressure starts immediately.
Throughout the session, sellers continue pushing prices lower.
The stock closes near ₹470.
This shows strong bearish sentiment.
Full Marubozu vs Partial Marubozu
Not all Marubozu candles look identical.
Full Marubozu
No upper wick.
No lower wick.
This is the strongest version.
Open Marubozu
One side has a tiny wick.
Still considered a strong signal.
Close Marubozu
Small wick appears near the close.
Momentum remains strong.
Psychology Behind Marubozu Candles
The most important part of technical analysis is understanding psychology.
Every candle tells a story.
A Marubozu tells us:
“One side completely controlled the market.”
For a Bullish Marubozu:
- Buyers entered aggressively.
- Sellers failed to stop the rally.
- Confidence increased throughout the session.
For a Bearish Marubozu:
- Sellers dominated.
- Buyers stayed weak.
- Fear increased throughout the session.
This psychological understanding helps traders interpret future market behavior.
Marubozu as a Trend Continuation Signal
One of the most common uses of Marubozu candles is identifying trend continuation.
Bullish Continuation Example
Suppose a stock is already in an uptrend.
Suddenly a large Bullish Marubozu appears.
This suggests:
- Buyers remain strong.
- Momentum is increasing.
- Uptrend may continue.
Bearish Continuation Example
A stock is falling.
A large Bearish Marubozu appears.
This suggests:
- Selling pressure remains strong.
- Bears remain in control.
- Downtrend may continue.
Marubozu as a Breakout Candle
Many successful breakouts begin with a Marubozu candle.
Why?
Because breakouts require strong momentum.
A Marubozu demonstrates exactly that.
Example
Suppose resistance exists at ₹1000.
Price struggles for several days.
Suddenly a Bullish Marubozu closes above ₹1000.
This indicates:
- Resistance has been broken.
- Buyers are aggressive.
- Breakout participants are entering.
Using Volume with Marubozu
Volume is extremely important.
A Marubozu without volume is less reliable.
A Marubozu with high volume becomes much stronger.
Why?
Volume shows participation.
High volume means:
- Institutions may be involved.
- More traders support the move.
- Momentum becomes more trustworthy.
Marubozu and Support Resistance
Location matters more than pattern.
A Marubozu appearing at an important level becomes more meaningful.
Bullish Marubozu at Support
Can indicate:
- Strong buying interest
- Reversal possibility
- Trend continuation
Bearish Marubozu at Resistance
Can indicate:
- Selling pressure
- Rejection
- Potential decline
Trading Strategy 1: Marubozu Breakout Strategy
Entry
Enter after the candle closes.
Stop Loss
Below Bullish Marubozu low.
Above Bearish Marubozu high.
Target
Use:
- Previous resistance
- Risk-reward ratio
- Trailing stop
This strategy is popular among momentum traders.
Trading Strategy 2: Marubozu Retest Strategy
Many professionals avoid chasing candles.
Instead they wait for a retest.
Example
Bullish Marubozu breaks resistance.
Price later returns to test that area.
Entry occurs near retest.
Benefits:
- Better risk management
- Smaller stop loss
- Improved reward potential
Trading Strategy 3: Marubozu with Moving Averages
Combine Marubozu with:
- 20 EMA
- 50 EMA
- 200 EMA
Example:
Bullish Marubozu above 20 EMA.
Trend remains strong.
Probability improves.
Trading Strategy 4: Marubozu with Volume Profile
Volume Profile traders often use:
- POC
- VAH
- VAL
A Bullish Marubozu above VAH often signals strong acceptance at higher prices.
A Bearish Marubozu below VAL may indicate strong weakness.
Common Mistakes Traders Make
Trading Every Marubozu
Not every Marubozu deserves a trade.
Context matters.
Ignoring Volume
Low-volume Marubozu candles can fail quickly.
Ignoring Trend
Trading against a strong trend increases risk.
Entering Before Candle Close
Many traders enter too early.
Always wait for candle completion.
Forgetting Risk Management
No pattern is 100% accurate.
Always use stop losses.
Marubozu vs Engulfing Pattern
Both indicate strength.
However:
Marubozu:
- Single candle pattern
- Shows pure momentum
Engulfing:
- Two candle pattern
- Shows reversal strength
Both are valuable but serve different purposes.
Marubozu vs Doji
Doji indicates:
- Indecision
- Balance
Marubozu indicates:
- Confidence
- Direction
- Momentum
They represent opposite market conditions.
Best Timeframes for Marubozu Trading
Different traders use different timeframes.
Scalpers
1 Minute
3 Minute
5 Minute
Intraday Traders
15 Minute
30 Minute
Swing Traders
1 Hour
4 Hour
Daily
Investors
Weekly
Monthly
Generally, higher timeframes provide more reliable signals.
Real Market Example
Imagine a stock trading near resistance for several days.
Price remains stuck.
Suddenly:
- Volume increases sharply.
- Bullish Marubozu forms.
- Resistance breaks.
This sequence indicates:
- Buyer conviction
- Fresh participation
- Potential trend expansion
Many successful momentum trades begin exactly this way.
Advantages of the Marubozu Pattern
- Easy to identify
- Beginner friendly
- Strong momentum signal
- Works in all markets
- Works in all timeframes
- Useful for breakouts
- Useful for trend trading
Limitations of the Marubozu Pattern
- Can create false breakouts
- May fail in sideways markets
- Needs confirmation
- Works better with volume
- Should not be used alone
How Professional Traders Use Marubozu
Professionals rarely trade a candle by itself.
They combine:
- Market structure
- Trend analysis
- Volume
- Support and resistance
- Volume Profile
- Risk management
The candle becomes a confirmation tool rather than the sole reason for a trade.
Real-Life Marubozu Example (Indian Stock)
Let’s take a practical example using a stock like Reliance Industries in Indian stock markets.
Imagine Reliance was trading between ₹2,450 and ₹2,500 for several days. Traders were unsure whether the stock would move higher or lower.
Then suddenly, on results day or after positive news:
- Open = ₹2,500
- High = ₹2,620
- Low = ₹2,498
- Close = ₹2,618
The candle forms as a large green body with almost no upper or lower wick.
This is a Bullish Marubozu.
What Happened Psychologically?
At market open, buyers immediately started purchasing.
As the day progressed:
- More buyers entered.
- Sellers could not push price down.
- Institutions may have participated.
- The stock kept moving higher.
The stock closed near the day’s high.
This tells us buyers controlled the market from start to finish.
What Would a Trader Do?
Aggressive Trader
Enter immediately after candle close.
Conservative Trader
Wait for next day’s pullback or retest.
Stop Loss
Below Marubozu low.
Target
Next resistance level.
Why This Pattern Matters
A Marubozu is not powerful because of its shape.
It is powerful because it represents:
- Strong conviction
- Strong momentum
- Strong participation
When it appears at:
- Breakouts
- Support levels
- High volume areas
its reliability increases significantly.
Simplified Visual Example
Bullish Marubozu

High/Close
    │
    █
    █
    █
    █
    █
    │
Open/Low
Almost no wick means buyers controlled the entire session.
How to Identify a High-Quality Marubozu
✅ Large body compared to previous candles
✅ High volume
✅ Breakout above resistance
✅ Appears in direction of trend
✅ Closes near day’s high (bullish)
✅ Closes near day’s low (bearish)
Common Indian Market Examples
You will frequently see Marubozu candles in stocks such as:
- Reliance Industries
- HDFC Bank
- Infosys
- Tata Consultancy Services
- ICICI Bank
especially during:
- Quarterly results
- Major announcements
- Breakouts from consolidation
- Market-wide rallies
Important Lesson
A Marubozu by itself is not a buy signal.
A Marubozu + Breakout + Volume + Trend = High-probability setup.
This is how professional traders usually use the pattern rather than trading every Marubozu they see.
Conclusion
The Marubozu Candlestick Pattern is one of the clearest expressions of market strength and conviction. Whether bullish or bearish, it reveals that one side dominated trading activity during the entire session.
For beginners, Marubozu is easy to understand and easy to identify. For experienced traders, it becomes a valuable tool for spotting breakouts, confirming trends, and understanding market sentiment.
However, the real power of the Marubozu pattern emerges when it is combined with volume analysis, support and resistance, trend direction, and proper risk management. Used correctly, it can become an important part of a trader’s decision-making process and help identify high-probability trading opportunities across stocks, forex, commodities, and cryptocurrencies.

Gaurav Heera is a seasoned Finance and Stock Market Expert with extensive experience in market education, investing, and trading. Through Asset Scholars, he shares practical knowledge and actionable insights to help individuals understand financial markets, build investment skills, and make informed wealth-creation decisions.


