Complete TradingView Tutorial (Beginner to Advanced)
Chapter 1: What Is TradingView?
TradingView is a cloud-based charting and market analysis platform used by millions of traders and investors around the world.
Before TradingView became popular, traders had to install heavy software on their computers. If they wanted to switch devices, they often lost their settings, drawings, and layouts.
TradingView solved this problem by moving everything to the cloud.
This means:
- Your charts are saved online.
- Your watchlists are saved online.
- Your indicators are saved online.
- Your drawings are saved online.
You can log in from:
- Desktop
- Laptop
- Mobile Phone
- Tablet
and continue exactly where you left off.
Why TradingView Became So Popular
Most traders initially think TradingView is just a charting software.
In reality it is much more.
TradingView combines:
Charting Platform
Allows market analysis.
Screening Platform
Allows finding stocks.
Alert System
Automatically notifies traders.
Social Network
Allows sharing ideas.
Strategy Testing Software
Allows testing trading systems.
Coding Platform
Allows creating custom indicators.
Broker Integration
Allows placing trades.
Think of TradingView as:
Charting Software + Scanner + Trading Journal + Social Network + Coding Platform
all combined together.
Note: Most beginners use only 20% of TradingView’s capabilities.
Chapter 2: Creating a TradingView Account
Step 1
Visit TradingView website.
Create account.
Options include:
- Apple
Step 2
Verify email.
Step 3
Login.
You will reach Dashboard.
Many beginners immediately open charts.
However, first understand the interface.
This saves weeks of confusion later.
Chapter 3: Understanding the TradingView Home Screen
When TradingView opens, you will see multiple sections.
Most beginners get overwhelmed because they see too many buttons.
Let’s break everything down.
Top Navigation Bar
Located at the very top.
Contains:
- Products
- Markets
- Screeners
- Community
- News
- Brokers
- Charts
These are the major sections of TradingView.
Charts Section
This is where traders spend 90% of their time.
Click:
Charts
A chart window opens.
This is your actual trading workspace.
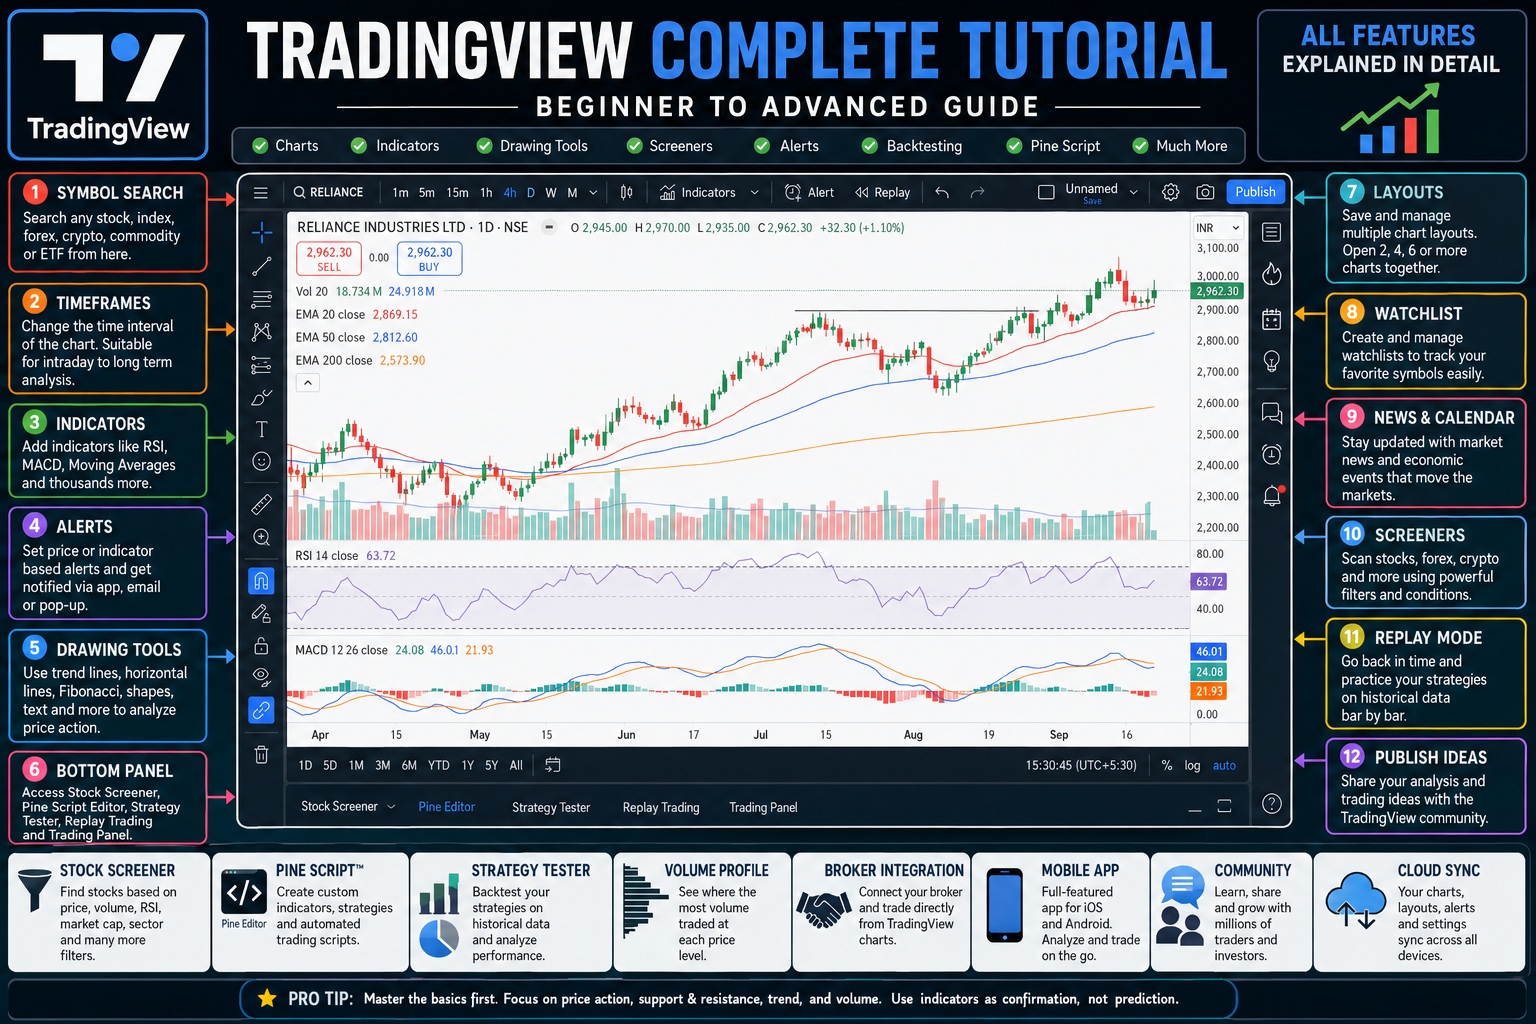
Chapter 4: Understanding Every Part of the Chart Window
When chart opens you’ll see four major areas.
Top Toolbar
Across the top.
Left Toolbar
Drawing tools.
Right Toolbar
Watchlist and alerts.
Bottom Panel
Pine Script and Strategy Tester.
Professional traders become experts in these four areas.
Chapter 5: Symbol Search (Most Important Feature)
Located at the top left.
Many beginners ignore its importance.
But every analysis begins here.
What Is A Symbol?
A symbol represents a financial asset.
Examples:
Stocks
RELIANCE
INFY
TCS
HDFCBANK
Indexes
NIFTY
BANKNIFTY
SENSEX
Forex
EURUSD
GBPUSD
USDJPY
Crypto
BTCUSD
ETHUSD
SOLUSD
Commodities
GOLD
SILVER
CRUDE OIL
How To Search A Symbol
Click symbol box.
Type:
Reliance
TradingView shows:
NSE:RELIANCE
Select it.
Chart loads.
Why Exchange Selection Matters
A stock can trade on multiple exchanges.
Example:
Infosys may appear on:
- NSE
- BSE
- International markets
Selecting wrong exchange can create confusion.
Always verify exchange name.
Chapter 6: Understanding Timeframes
After selecting a symbol you’ll notice:
1m
5m
15m
1H
4H
1D
1W
1M
These are timeframes.
What Is A Timeframe?
A timeframe determines how much time each candlestick represents.
Example:
1 Minute Chart
One candle = 1 minute
5 Minute Chart
One candle = 5 minutes
Daily Chart
One candle = One day
Weekly Chart
One candle = One week
How Different Timeframes Tell Different Stories
Imagine Reliance stock.
Daily chart may show:
Strong uptrend.
But 5-minute chart may show:
Short-term decline.
Both can be correct.
This is why professionals always use multiple timeframes.
Multi-Timeframe Analysis
Professionals rarely trade from a single timeframe.
Example:
Daily Chart
Determines overall trend.
4 Hour Chart
Finds setup.
1 Hour Chart
Finds entry.
15 Minute Chart
Fine-tunes execution.
This approach dramatically improves decision making.
Chapter 7: Chart Types
Most traders only use Candlesticks.
But TradingView offers many chart styles.
Candlestick Chart
Most popular.
Shows:
- Open
- High
- Low
- Close
This is the standard chart type.
Line Chart
Shows only closing prices.
Good for investors.
Not ideal for active traders.
Bar Chart
Older version of candlesticks.
Used less today.
Area Chart
Looks visually appealing.
Often used by investors.
Heikin Ashi
One of the most misunderstood chart types.
It smooths price action.
Makes trends easier to identify.
Many swing traders use it.
Renko Chart
Removes time completely.
Focuses only on price movement.
Useful for trend followers.
Point and Figure
Very old charting method.
Filters market noise.
Used by some institutional analysts.
Chapter 8: Understanding Candlestick Charts
Every candle tells a story.
Each candle contains:
Open
Starting price.
High
Highest price reached.
Low
Lowest price reached.
Close
Final price.
Green Candle
Buyers dominated.
Close above open.
Red Candle
Sellers dominated.
Close below open.
Long Body Candle
Strong momentum.
Small Body Candle
Weak momentum.
Long Wick Candle
Price rejection.
Extremely important in price action trading.
Chapter 9: Chart Settings (Every Option Explained)
Right-click chart.
Select Settings.
Many traders never explore these settings.
Huge mistake.
Symbol Tab
Controls candle appearance.
You can change:
- Candle color
- Wick color
- Border color
Status Line
Controls information shown at top.
Displays:
- Open
- High
- Low
- Close
- Percentage change
Scales
Controls price scale behavior.
Very useful when comparing assets.
Appearance
Changes:
- Background
- Grid
- Session breaks
- Watermark
Many professional traders use dark themes to reduce eye strain.
Trading Tab
Controls order display.
Useful if connected to broker.
Chapter 10: Left Toolbar Complete Explanation
This toolbar contains drawing tools.
Professional traders spend more time here than with indicators.
Why?
Because price action matters more than indicators.
Trend Line Tool
Most used tool.
Location:
Left Toolbar → Trend Line
Used for:
- Uptrends
- Downtrends
- Trend breaks
Horizontal Line Tool
Used for:
- Support
- Resistance
Probably the most valuable tool on TradingView.
Horizontal Ray
Extends forever.
Useful for future support resistance levels.
Rectangle Tool
Used to mark:
- Demand zones
- Supply zones
- Consolidation areas
Extremely popular among SMC traders.
Brush Tool
Allows freehand drawing.
Useful during teaching and presentations.
Arrow Tool
Used for marking entries and exits.
Text Tool
Allows chart notes.
Useful for maintaining a trading journal.
Chapter 11: Indicators Section Complete Guide
Click Indicators.
Thousands of indicators appear.
Beginners often become obsessed with indicators.
Professional traders focus on a few.
Moving Average
Most used indicator globally.
Purpose:
Identify trend.
20 EMA
Short-term trend.
50 EMA
Medium-term trend.
200 EMA
Long-term trend.
Institutions closely monitor it.
RSI
Measures momentum.
Range:
0–100
Above 70:
Potential overbought.
Below 30:
Potential oversold.
MACD
Shows trend and momentum together.
Popular among swing traders.
Bollinger Bands
Measures volatility.
Useful for breakout traders.
VWAP
Institutional favorite.
Extremely important for intraday traders.
Supertrend
Beginner-friendly trend indicator.
Very popular in India.
This is only about the first 25–30% of a true complete guide. The remaining sections would cover:
- Volume Analysis
- Volume Profile (POC, VAH, VAL)
- Watchlists
- Alerts
- Replay Mode
- Stock Screener
- Forex Screener
- Crypto Screener
- Economic Calendar
- Compare Feature
- Layout Management
- Templates
- Pine Script Basics
- Strategy Tester
- Broker Connections
- Risk Management Tools
- Smart Money Concepts Tools
- Advanced Chart Settings
- Keyboard Shortcuts
- Mobile TradingView Tutorial
- Professional Trading Workflows
- Common Mistakes and Best Practices
Conclusion
Most beginners try to learn TradingView by clicking random buttons. A better approach is to master the platform layer by layer: first charts, then drawing tools, then indicators, then alerts, then screeners, and finally advanced features like Volume Profile, Pine Script, and Strategy Tester. TradingView is powerful softwares in technical analysis because it can grow with you—from your first chart to professional-level stock market analysis.

Gaurav Heera is a seasoned Finance and Stock Market Expert with extensive experience in market education, investing, and trading. Through Asset Scholars, he shares practical knowledge and actionable insights to help individuals understand financial markets, build investment skills, and make informed wealth-creation decisions.


