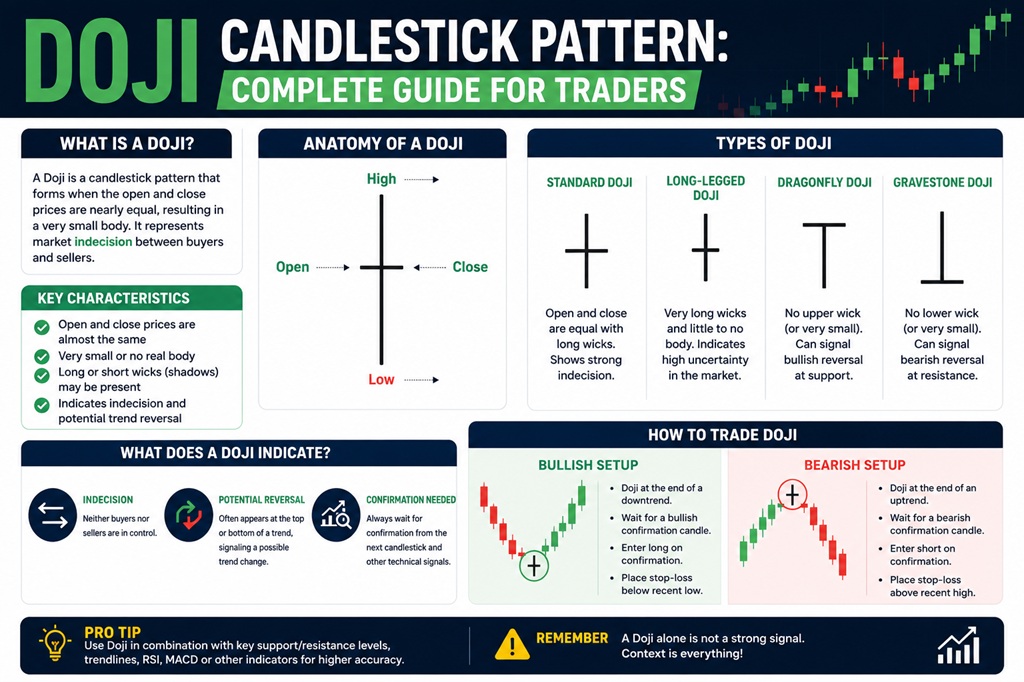
A Doji is a candlestick where the opening price and closing price are almost the same.
Price went up and down during that time, but at the end, it came back to where it started.
So on the chart it looks like:
A very thin or no real body (because open ≈ close)
One or two wicks (shadows) going up and/or down
In simple words:
The market moved, but it couldn’t decide who should win – buyers or sellers. That is why the Doji is called a candle of indecision.
2. Why is a Doji important?
Candles are like a story of that time period.
A strong green candle says: “Buyers were in control.”
A strong red candle says: “Sellers were in control.”
A Doji says: “Nobody was clearly in control. Both sides fought, but it ended in a draw.”
Because of this, a Doji can give you a warning:
The current trend might be losing strength
Market might be taking a pause
A reversal or bigger move may be near – but not always
So, you should never treat Doji as “buy here” or “sell here” blindly.
Think of it as a sign saying: “Stop. Look carefully. Something is changing in the mood.”
3. How exactly a Doji forms (step‑by‑step)
Let’s walk through one candle’s life:
Market opens
Price starts at, say, 100.
Price moves
Maybe first it goes to 105, then down to 97
Or first down to 95, then up to 104
That high and low form the wicks.
End of the session
Price comes back around 100 and closes there, almost the same as the open.
So what does this tell you?
Buyers tried to push up.
Sellers tried to push down.
In the end, both sides cancelled each other out.
That’s the entire psychology behind a Doji – tug of war with no clear winner.
4. Types of Doji (with psychology)
Now let’s talk about the common types. The idea is the same (open ≈ close), but the shape and wicks change the meaning slightly.
4.1 Standard Doji
Shape: looks like a small cross or “+”.
Small or no body
Small upper and lower wicks
Meaning:
Perfect indecision
Neither side showed strong power
Often a pause candle in the middle of a move or in a range
Alone, it’s not a strong buy/sell signal. You need context.
4.2 Dragonfly Doji
Shape: looks like a “T”.
Open and close near the top of the candle
Very long lower wick
Almost no upper wick
Story:
Market opened
Sellers pushed the price down a lot
Then buyers came in strongly, pushed it all the way back up
It closed near the open (near the high)
Psychology:
Strong rejection of lower prices
Buyers defended that lower area aggressively
Where it matters:
After a downtrend, near a support zone, a dragonfly Doji can hint that selling pressure is weakening and buyers are stepping in.
But again, you want confirmation from the next candles or other tools, not just one candle.
4.3 Gravestone Doji
Shape: like an upside‑down T.
Open and close near the bottom of the candle
Very long upper wick
Almost no lower wick
Story:
Market opened
Buyers pushed the price higher
Then sellers came in hard and pushed it back down
It closed near the open (near the low)
Psychology:
Strong rejection of higher prices
Sellers defended the upper area strongly
Where it matters:
After an uptrend, near resistance, a gravestone Doji can warn that buying strength is fading and sellers are showing up.
Again, it is a warning, not an automatic sell button.
4.4 Long‑Legged Doji
Shape:
Very small body in the middle
Very long upper and lower wicks
Looks like a cross with long “legs”
Story:
Price went high.
Price went low.
But closed near where it opened.
Psychology:
Very strong indecision
Market was wild, both sides fought aggressively
But still no clear winner at the end
You often see it when volatility is high and the market is trying to find direction.
5. Doji in different places on the chart
A Doji’s meaning changes depending on where it appears.
5.1 Doji after a strong uptrend
Imagine the market has been going up for many candles, higher highs, higher lows.
Suddenly, you see a Doji at or near a resistance zone.
What can this mean?
Buyers, who were clearly dominant, are now hesitating.
Sellers are finally matching their strength.
It may be an early sign that the uptrend is slowing or about to reverse.
You still need:
A confirming bearish candle after it, or
Break of a support level, or
Some other indicator/price action sign
Never short just because “Doji means reversal”. It doesn’t always.
5.2 Doji after a strong downtrend
Now imagine the market is falling strongly, big red candles, lower lows.
Near a support area, a Doji appears.
Possible meaning:
Sellers who were dominating are now less confident.
Buyers are starting to defend that level.
A bounce or reversal may come.
Again, one Doji does not guarantee reversal. It just says: “Bears are not as strong as before.”
5.3 Doji in a sideways or ranging market
When the market is already moving sideways between support and resistance, Doji candles are very common.
Here, a Doji is less special, because:
Market is already in indecision
Both sides are already balanced most of the time
So in ranges, you don’t overreact to every Doji. You focus more on the boundaries (support/resistance) and breakouts.
6. Common mistakes people make with Doji
Let’s talk about the traps, because many traders lose money by over‑trusting Doji.
Mistake 1: Treating every Doji as a reversal signal
Reality:
Doji = indecision, not automatic reversal
Market can continue in the same direction after a Doji, especially in a strong trend
Better approach:
Think: “Trend is pausing, I should watch closely”
Look for confirmation from next candles and levels
Mistake 2: Ignoring the bigger trend
Many beginners stare at a single Doji and forget to zoom out.
Always ask:
What is the higher time frame trend?
Is this Doji at a major support/resistance zone, or just in the middle of nowhere?
Is the overall market sentiment strong or weak?
A Doji against a strong trend often fails.
A Doji with context (trend exhaustion + level + confirmation) is more meaningful.
Mistake 3: Trading Doji without a plan
People see a fancy pattern on YouTube and then:
Enter without stop loss
No fixed target
No risk per trade defined
No backtest
Then when it fails, they blame the pattern.
Pattern is just one part. You still need:
Risk management
Clear rules for entry and exit
Position sizing
Emotional control
7. How to practically use Doji in a strategy
Let’s build a simple, logical way to use Doji instead of random guessing.
Gaurav Heera is a seasoned Finance and Stock Market Expert with extensive experience in market education, investing, and trading. Through Asset Scholars, he shares practical knowledge and actionable insights to help individuals understand financial markets, build investment skills, and make informed wealth-creation decisions.