The Morning Star is a bullish reversal pattern made of three candles that usually appears after a downtrend.
In plain words:
It tells you the market was falling,
Then the selling pressure slowed down,
And then buyers stepped in strongly.
The name “Morning Star” comes from the idea of the last star in the sky before sunrise – it shows up just before a new day begins. Same idea here: after dark (downtrend), this pattern hints that a new “day” (uptrend) might start.
Very important:
Morning Star does not guarantee a reversal. It only signals that the odds of a bullish turn have increased.
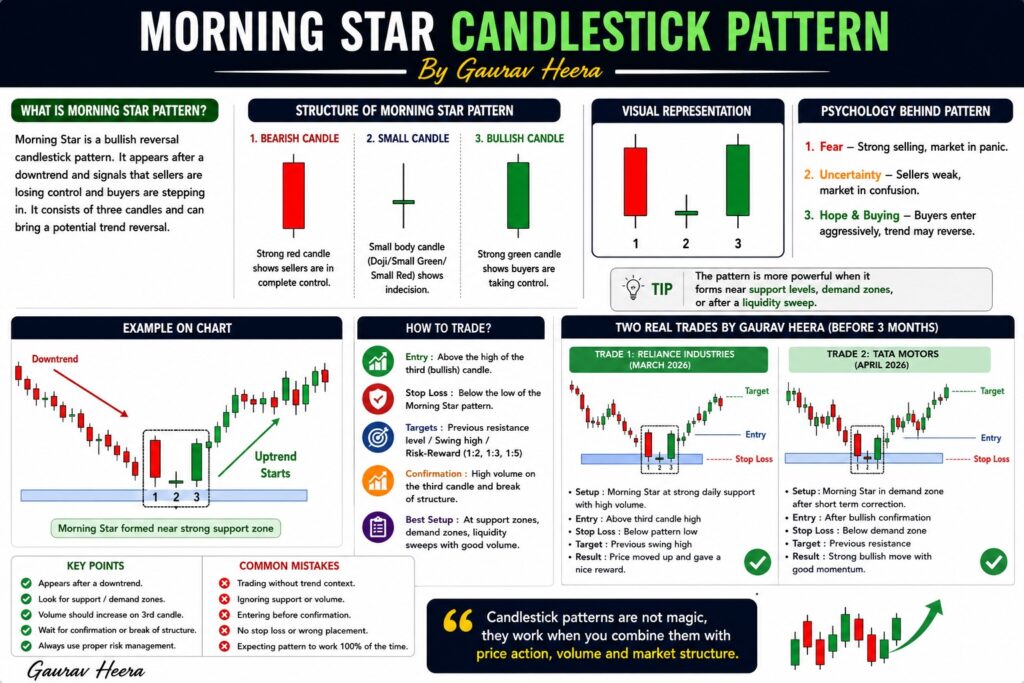
Structure: The 3 candles of the Morning Star
Think of it as a small story in three parts.
Candle 1: Strong bearish candle
Appears in an existing downtrend
Long red (bearish) body
Shows that sellers are in full control
This candle continues the existing fall. Nothing bullish here yet.
Candle 2: Small candle (the “star”)
Gaps down below the close of the first candle (on many markets/timeframes)
Small body: can be bullish or bearish
Often looks like:
a small real body
or a doji (open ≈ close)
Shows indecision or a pause in the selling
This is the “star” – the market is no longer clearly in the hands of sellers. They’re getting tired. Buyers are slowly waking up.
Candle 3: Strong bullish candle
Opens near or slightly above the second candle
Closes well into the body of the first bearish candle, ideally beyond the halfway point
Long green (bullish) body
This is where buyers finally take control. The stronger and deeper this third candle moves into the first candle’s body, the more powerful the Morning Star signal.
Put together:
Big red – bears dominant
Small candle – indecision
Big green – bulls take over
The psychology behind the Morning Star
Forget the names for a moment and imagine what the traders are feeling.
Before the pattern
Market has been going down for a while.
Most people are bearish or scared.
Sellers feel confident, buyers are quiet.
First candle
A big bearish candle forms:
Sellers push price down further.
Bears feel strong: “Trend is fine, we’re in control.”
Bulls are still weak.
Second candle (the star)
Next period:
Price opens lower (gap down), so it looks like more selling will come.
But then price doesn’t move strongly in one direction.
It just hovers in a small range, forming a small candle.
Emotionally, this means:
Bears are not as aggressive as before.
Some buyers might be testing the waters.
Market is undecided now.
Third candle
Now the key:
Buyers step in aggressively.
Price moves up strongly and closes far inside the first candle’s body.
Message:
Bears are losing control.
Buyers have taken the wheel.
The downtrend is in trouble.
That’s why Morning Star is considered a bullish reversal pattern: a clear shift from selling pressure to buying pressure.
How to recognise a “good” Morning Star (not just anything)
You will see many three‑candle combinations on charts. Not all are Morning Stars. Here are practical rules you can use.
There must be a prior downtrend
The pattern should appear after a falling market.
If it appears after an uptrend or in the middle of a sideways range, it loses meaning.
First candle: strong bearish
Relatively long red body.
Clearly continuing the downtrend.
Second candle: small body below the first close
Ideally, it gaps down from the first candle.
Small body (can be red or green).
It shows hesitation, not strength.
Third candle: strong bullish
Long green body.
Closes at least halfway into the first candle’s body, preferably more.
The deeper it goes, the stronger the pattern.
Location near a support zone is a big plus
If the pattern appears near a known support level or demand zone, it becomes more meaningful.
A random Morning Star in no man’s land is less reliable.
When these points line up, you have a solid Morning Star, not just three random candles.
Morning Star vs. Evening Star (and other confusion)
You might hear “Evening Star” also, so let’s keep them straight.
Morning Star
Appears after a downtrend
Bullish reversal (from down to up)
Evening Star
Appears after an uptrend
Bearish reversal (from up to down)
Same idea, opposite direction.
Don’t mix them: “morning” = new bullish day; “evening” = end of bullish day.
Morning Star is also different from single‑candle patterns like hammer or engulfing. It uses three candles to tell a gradual story of bears losing control and bulls gaining it.
How to trade the Morning Star (step by step)
Let’s turn this into something practical you could really use.
Step 1: Check the trend
Ask first:
“Is the market clearly in a downtrend on this time frame?”
Lower highs and lower lows
Series of red candles
Or price below a key moving average (if you use them)
If there’s no clear downtrend, skip it. The Morning Star is a reversal pattern, so it needs something to reverse.
Step 2: Spot the pattern at the right place
You don’t want to trade every Morning Star you see. Focus on those near:
Horizontal support zones
Previous swing lows
Demand areas where price has bounced before
Morning Star + Support = much stronger signal than Morning Star floating in the middle.
Step 3: Wait for the whole 3‑candle pattern to complete
Be patient:
Long red candle appears.
Next candle forms the star (small body).
Next candle forms a strong green that closes deep into the first.
Only after the third candle closes can you say, “Yes, this is a Morning Star.”
Step 4: Plan entry
Common methods:
Aggressive entry
Enter at or near the close of the third bullish candle.
Conservative entry
Wait for the next candle to break above the high of the third candle.
This gives extra confirmation but you enter a bit later.
Choose what fits your style. Newer traders often like the slightly safer, confirmation‑based entry.
Step 5: Place stop loss
A simple and common idea:
Put your stop loss just below the low of the star or the entire pattern (usually below the second candle’s low).
Logic: if price breaks that low, the pattern has failed and the downtrend may continue.
Never skip the stop. Patterns fail sometimes; risk control keeps you in the game.
Step 6: Decide your target
You can:
Aim for the next resistance level (previous swing high, supply zone).
Or use a fixed risk:reward ratio like 1:2 or 1:3.
Or trail the stop as price moves in your favour.
The key is to decide before entering, not emotionally in the middle of the trade.
Example: Visualising a Morning Star
Imagine this simple story:
Stock is in a downtrend, falling from 200 to 150.
First candle of the pattern:
Opens at 160, closes at 150
Big red body continuing the fall.
Second candle:
Opens at 148 (gap down), trades between 147 and 150
Closes at 149 with a small body.
Third candle:
Opens around 150
Rallies strongly and closes at 160, well into the body of the first red candle.
You now have:
Strong red
Small indecisive candle (the star)
Strong green that closes above the midpoint of the first candle’s body
This is a textbook Morning Star after a downtrend, near a potential support area.
Possible approach:
Enter near the close of the third candle or on a break above its high.
Stop loss below the lowest low of the pattern.
Target a previous resistance zone (maybe around 170–175).
Common mistakes traders make with Morning Star
To really use this pattern well, you also need to know what not to do.
Mistake 1: Ignoring the trend
Trading a Morning Star in a sideways or choppy market, or at the top of an uptrend, reduces its value. Always ask: “Am I actually at the end of a downtrend, or just in random noise?”
Mistake 2: Not caring about the third candle’s strength
If the third candle is small, weak, or doesn’t close at least halfway into the first candle’s body, the pattern is weaker. The whole point is that buyers must show strength.
Mistake 3: No risk management
Even perfect patterns fail. Entering big size without stop loss just because “Morning Star is strong” is how accounts get blown. Always plan your risk first.
Mistake 4: Seeing Morning Stars everywhere
Be strict:
clear downtrend
proper 3‑candle structure
strong third candle
ideally near support
If any of these are missing, treat it as a lower‑quality setup.
Morning Star on different time frames
You can find Morning Stars on:
5‑minute charts
15‑minute / 1‑hour charts
4‑hour, daily, weekly charts
Some points to keep in mind:
On lower time frames, you will see more patterns and more noise. Many will fail because intraday movement is choppy.
On higher time frames (daily, weekly), the pattern is rarer but generally more reliable.
If you are still learning, daily charts are usually a good place to train your eyes on Morning Stars before going to intraday.
How to practice and really internalise the Morning Star
If you want to get good, do this practical exercise:
Pick a market you follow (Nifty, Bank Nifty, a favourite stock, forex pair, crypto).
Open a daily chart and scroll back a few years.
Mark every clean Morning Star after a downtrend.
For each one, note:
Did it appear near a support zone?
How strong was the third candle?
What happened next – did price reverse, move sideways, or fall again?
Take screenshots and make a small “Morning Star journal”.
After you study 30–50 examples like this, you will start spotting high‑quality patterns in live charts much faster and more confidently.
Conclusion
To bring everything about the Morning Star candlestick pattern together, think of it as a very clear story of power changing hands.
The market starts in a downtrend, with sellers clearly in control. The first candle of the pattern continues this story with a strong bearish move. Then the second candle – the “star” – shows up as a small candle that pauses the fall. This is the first hint that sellers are getting tired and buyers are slowly waking up. Finally, the third candle comes in strong and bullish, pushing price back up into the body of the first candle. That last candle is the punchline: it shows buyers taking control from sellers and signals that the downtrend might be ending.
Used correctly, the Morning Star is not just three random candles; it’s a bullish reversal clue that works best when:
It appears after a clear downtrend
It forms near support or a demand zone
The third candle is a strong green candle closing well into the first candle’s body
You combine it with confirmation and risk management (planned entry, stop loss under the pattern, and realistic targets)
If you treat the Morning Star as one part of a full trading plan – along with levels, trend, volume, and position sizing – it can help you spot genuine shifts from bearish to bullish mood instead of guessing bottoms blindly.
Gaurav Heera is a seasoned Finance and Stock Market Expert with extensive experience in market education, investing, and trading. Through Asset Scholars, he shares practical knowledge and actionable insights to help individuals understand financial markets, build investment skills, and make informed wealth-creation decisions.