
Hammer Candlestick Pattern: The Complete Guide to Understanding, Identifying and Trading the Hammer Candle
If you have ever looked at a candlestick chart and seen a candle with a small body at the top and a long lower shadow, you may have wondered:
“What is this candle trying to tell me?”
That candle may be a Hammer Candlestick Pattern.
The Hammer is one of the most popular candlestick patterns used by traders to identify a possible bullish reversal, especially after a decline in price.
But there is one very important thing I want you to understand right from the beginning:
A Hammer candle by itself is not a buy signal.
This is probably the biggest mistake beginners make.
They see a Hammer.
They immediately think:
“Price will go up. Buy!”
That is not how professional candlestick analysis works.
A Hammer becomes much more meaningful when you understand where it is forming, what happened before it, how price behaved during the candle, what volume is showing, and what happens after the Hammer is formed.
So in this article, I am not going to simply tell you the definition of a Hammer and move on.
I want to teach you how to read the story behind the Hammer.
Think of this as a one-to-one classroom session.
1. What Is a Hammer Candlestick Pattern?
A Hammer is a bullish candlestick pattern that generally appears after a decline in price and indicates that sellers were able to push the price significantly lower during the trading session, but buyers eventually entered and pushed the price back toward the upper part of the candle.
Visually, a Hammer usually has:
- A small real body
- A long lower shadow
- Very little or no upper shadow
- The body positioned near the top of the candle
- A lower wick generally at least around twice the size of the body
A simplified structure looks like this:
        ┌─────┐
        │     │
        │Body │
        │     │
        └─────┘
           │
           │
           │
           │
           │
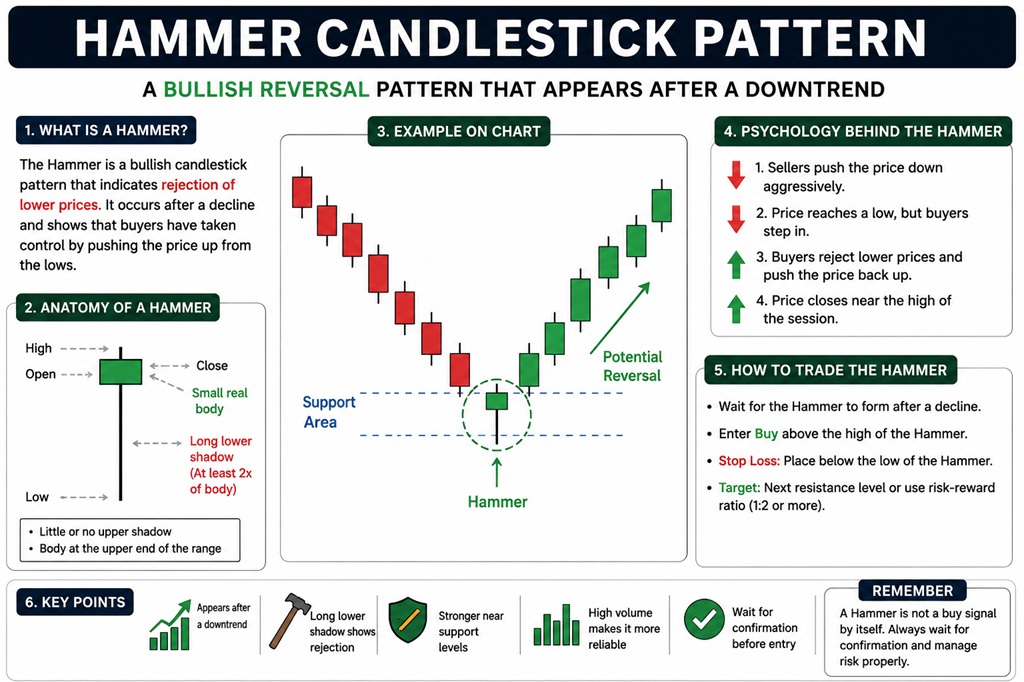
The important feature is the long lower wick.
But don’t just memorize:
“Long wick = Hammer.”
That’s not enough.
The location of the candle is extremely important.
2. Why Is It Called a Hammer?
The name comes from the appearance and behavior of the candle.
Imagine a hammer.
It has a relatively small head and a long handle.
The Hammer candlestick visually resembles this structure.
But the name is less important than the story behind the candle.
The real question is:
Why did price create that long lower shadow?
Suppose a stock is trading at ₹500.
During the session:
- It opens around ₹500
- Sellers become aggressive
- Price falls to ₹480
- Buyers start entering
- Price recovers
- The stock closes around ₹498
Look at what happened.
The market went from approximately:
₹500 → ₹480 → ₹498
That means sellers managed to push the price ₹20 lower.
But they couldn’t maintain those lower prices.
Buyers came in and pushed the price back up.
That creates the long lower shadow.
And that is where the real importance of the Hammer begins.
3. The Psychology Behind a Hammer
If you want to become good at candlestick analysis, don’t simply memorize candle names.
Learn to understand market psychology.
Let’s imagine a stock has been falling for several days.
Suppose the price sequence looks something like:
₹600
↓
₹590
↓
₹575
↓
₹560
↓
₹545
↓
₹530
The market is clearly under selling pressure.
Sellers are controlling the market.
Now imagine that on the next day, the stock opens at ₹530.
Initially, sellers continue their attack.
The price falls:
₹530 → ₹520 → ₹510 → ₹500
At this point, many traders become bearish.
Some traders may think:
“The stock is breaking down.”
Others may short the stock.
Stop-loss orders from existing long positions may also get triggered.
The selling pressure increases.
But then something changes.
At ₹500, buyers start entering aggressively.
Perhaps ₹500 is:
- A previous support level
- A demand zone
- A major moving average
- A previous swing low
- A psychological round number
- An area where institutional buying is occurring
Buyers absorb the selling.
Price begins moving upward.
₹500 → ₹510 → ₹520 → ₹525 → ₹528
Eventually, the stock closes near ₹528.
Now look at the candle.
The session started around ₹530.
Price went all the way down to ₹500.
But it recovered and closed near ₹528.
That produces a long lower wick.
This is the basic psychological story of a Hammer.
Sellers controlled the beginning.
Buyers eventually fought back.
Sellers pushed price down.
Buyers rejected lower prices.
Price closed near the upper portion of the candle.
That is why the Hammer can be interpreted as a sign of rejection of lower prices.
4. The Most Important Thing: A Hammer Must Usually Appear After a Decline
This is one of the most important concepts in candlestick trading.
A Hammer is meaningful primarily when it appears after a decline or at a potentially important support area.
Imagine you see this candle:
    █
    █
    █
    │
    │
    │
You might immediately say:
“Hammer!”
But I would ask you:
Where did it form?
If it formed after a strong decline, it could indicate a potential bullish reversal.
If the same candle appears in the middle of a sideways market, its significance may be much lower.
If it appears during an established uptrend, it may not represent the same reversal setup at all.
This is why:
Candlestick pattern + market context = meaningful analysis.
Not:
Candlestick pattern alone = trade.
5. The Anatomy of a Hammer
Let’s break the Hammer down into its individual components.
5.1 Real Body
The real body represents the difference between:
- Opening price
- Closing price
The body can be:
- Green/bullish
- Red/bearish
Many beginners believe that a Hammer must always be green.
That’s not strictly correct.
A Hammer can have a bearish-colored body and still technically resemble a Hammer.
However, a bullish close can provide additional evidence that buyers were able to regain control.
For example:
Bullish Hammer
Open = ₹100
Low = ₹90
Close = ₹103
High = ₹105
The candle closes above its opening price.
This is generally stronger psychologically because buyers not only recovered the decline but also managed to push the closing price above the opening price.
6. How Long Should the Lower Wick Be?
There is no magical mathematical number that guarantees a Hammer.
However, a common guideline is:
Lower shadow ≈ at least 2× the body
For example:
Body = 5 points
Lower wick = 10 points or more
That would fit the commonly taught Hammer structure.
But remember:
Candlestick patterns are not rigid mathematical formulas.
A wick doesn’t become meaningful merely because it is exactly 2.01 times the body.
Context matters more.
A Hammer with:
- strong support
- high volume
- oversold conditions
- bullish confirmation
- favorable market structure
may be far more meaningful than a textbook-perfect Hammer appearing randomly in the middle of a chart.
7. What About the Upper Wick?
A traditional Hammer generally has:
- Small or negligible upper shadow
- Long lower shadow
- Small body near the top
A very long upper wick can change the interpretation.
Why?
Because a long upper wick tells us that sellers also rejected higher prices.
Therefore, if the candle has substantial rejection on both sides, it may not have the clean psychological structure of a classic Hammer.
This is why you shouldn’t label every candle with a long lower wick as a Hammer.
8. Does a Hammer Have to Be Green?
No.
This is a very common misconception.
A Hammer can be:
Bullish Hammer
The close is above the open.
or
Bearish-colored Hammer
The close is below the open.
However, all else being equal, a bullish Hammer may provide stronger evidence because buyers managed to close the candle above the opening level.
Let’s understand this with an example.
Example 1
Open = ₹100
Low = ₹90
Close = ₹104
Buyers recovered strongly.
This is a bullish Hammer.
Example 2
Open = ₹104
Low = ₹90
Close = ₹100
There was still significant recovery from the low, but sellers maintained some control and the candle closed below the open.
The structure may still resemble a Hammer, but the bullish evidence is somewhat weaker.
9. The Hammer Is About Rejection
If you remember only one concept from this entire article, remember this:
Hammer = Rejection of Lower Prices
The long lower wick tells us that the market traded at lower prices but did not remain there.
This doesn’t automatically mean that the market must reverse.
Instead, it tells us:
Lower prices were rejected during that session.
That’s an important distinction.
Rejection is not confirmation.
Think about it like this.
The Hammer says:
“Something interesting happened here.”
The next candles tell you:
“Whether that interest actually turned into a reversal.”
10. Hammer vs Buying Signal
This distinction can save you from many bad trades.
Suppose you see:
Downtrend
↓
↓
↓
Hammer
Should you immediately buy?
Not necessarily.
You could instead wait for confirmation.
For example:
Downtrend
↓
↓
↓
Hammer
↓
Bullish confirmation
Now the setup may be more convincing.
One common approach is to consider a bullish breakout above the Hammer’s high.
Suppose:
Hammer high = ₹510
Hammer low = ₹490
A trader may consider a bullish entry if price subsequently breaks above ₹510.
This means:
Hammer = setup
Break above Hammer high = confirmation
This is a much more disciplined way of thinking.
11. Why Confirmation Matters
Imagine a stock falls to ₹100 and forms a Hammer.
You buy at ₹105.
The next candle opens at ₹104.
Then suddenly:
₹104 → ₹100 → ₹96
The Hammer failed.
Why?
Because the market did not follow through on the bullish rejection.
The Hammer showed a temporary buying response.
It did not guarantee a trend reversal.
Now imagine another situation.
Stock falls to ₹100.
Hammer forms.
Next day:
₹105 → ₹108 → ₹112
Now buyers are demonstrating follow-through.
This is much more interesting.
Therefore:
The reaction after the Hammer can be more important than the Hammer itself.
12. Hammer at Support
One of the strongest environments for a Hammer is around an important support zone.
Suppose a stock has repeatedly found buyers around ₹1,000.
You observe:
₹1,050 → ₹1,000 → bounce
Later:
₹1,080 → ₹1,000 → bounce
Again:
₹1,100 → ₹1,000 → Hammer
Now you have multiple pieces of information.
The market is telling you:
“₹1,000 is an area where buyers have previously shown interest.”
If a Hammer appears there, the pattern becomes much more meaningful.
This is called confluence.
13. What Is Confluence?
Confluence means multiple independent pieces of evidence support the same trade idea.
For example:
Factor 1
Price reaches major support.
Factor 2
Hammer forms.
Factor 3
Volume increases.
Factor 4
The next candle breaks the Hammer high.
Factor 5
The broader market is bullish.
Factor 6
Price structure suggests a potential trend reversal.
Individually, each factor may not be enough.
Together, they create a stronger setup.
This is how professional traders generally think.
They don’t ask:
“Did I find a Hammer?”
They ask:
“How many things are supporting this Hammer?”
14. Hammer at Demand Zone
If you use supply and demand analysis, a Hammer can become particularly interesting when it appears at a demand zone.
Imagine price falls into a previously established demand area.
At that area:
- Buyers become active
- Selling pressure gets absorbed
- Price rejects lower levels
- Hammer forms
The Hammer is now providing candlestick evidence that the demand zone may be reacting.
This is much more useful than randomly finding a Hammer somewhere on the chart.
15. Hammer and Moving Averages
A Hammer can also be combined with moving averages.
For example, suppose a stock is trading above its 50 EMA.
Price temporarily pulls back toward the 50 EMA.
At the moving average, a Hammer forms.
Then price breaks above the Hammer’s high.
You now have:
- Existing bullish trend
- Pullback
- Dynamic support
- Hammer
- Bullish confirmation
This could create a continuation setup rather than a major reversal setup.
And this is an important point:
A Hammer doesn’t always have to mean a complete trend reversal.
It can also appear during a pullback in an existing uptrend.
16. Hammer During an Uptrend
Let’s say the stock is trending upward:
₹100
↑
₹110
↑
₹120
↓
₹115
↓
Hammer
↑
₹125
Here, the Hammer formed during a temporary correction.
This can indicate that sellers attempted to push price lower but buyers defended the area.
In this situation, you might interpret the Hammer as:
Bullish continuation / pullback rejection
rather than:
Major trend reversal
This is why market structure matters.
17. Hammer After a Strong Downtrend
Now consider:
₹500
↓
₹470
↓
₹440
↓
₹410
↓
₹380
↓
Hammer
↑
₹400
↑
₹425
Here, the Hammer is appearing after a significant decline.
This could potentially indicate:
Bearish momentum weakening
and
Buyers attempting to establish control.
But again, confirmation is important.
A single Hammer doesn’t magically transform a downtrend into an uptrend.
18. Hammer and Volume
Volume can provide another layer of information.
Imagine a Hammer forms with extremely low volume.
The rejection may still matter, but there is less evidence of strong participation.
Now imagine:
- Price reaches major support
- Hammer forms
- Volume is significantly above average
- Next candle breaks the Hammer high
This can provide stronger evidence.
Why?
Because the volume suggests that the activity around that price level was meaningful.
You could think of it like this:
Hammer + normal volume
Potentially interesting.
Hammer + strong volume
More interesting.
Hammer + strong volume + support + confirmation
Potentially a much stronger setup.
Again, not guaranteed.
19. Hammer and RSI
Some traders combine the Hammer with RSI.
Suppose price has fallen significantly.
RSI reaches an oversold area.
Price reaches support.
A Hammer forms.
Then price breaks the Hammer high.
Now you have:
- Support
- Hammer
- Oversold momentum
- Bullish confirmation
This creates confluence.
But be careful.
An RSI reading below 30 does not automatically mean price must rise.
Strong downtrends can remain oversold for extended periods.
So RSI should support your analysis, not replace it.
20. Hammer and Market Structure
This is where candlestick analysis becomes much more advanced.
Instead of looking at individual candles, look at the sequence of:
- Higher highs
- Higher lows
- Lower highs
- Lower lows
Suppose the market is making:
Lower Low
↓
Lower High
↓
Lower Low
↓
Lower High
↓
Hammer
The Hammer alone does not establish an uptrend.
You might want to see the market eventually break an important lower high.
For example:
Lower Low
     ↓
Hammer
     ↑
Break of previous Lower High
     ↑
Potential structure shift
Now the Hammer is part of a broader market-structure story.
21. Hammer and Smart Money Concepts
If you use Smart Money Concepts, you can combine the Hammer with concepts such as:
- Liquidity sweep
- Order block
- Demand zone
- Break of Structure
- Change of Character
- Fair Value Gap
- Premium and Discount
For example:
Price moves below a previous swing low.
This triggers liquidity.
Then price quickly returns above that level and forms a Hammer.
This can be interpreted as a rejection after a liquidity sweep.
If price then breaks a nearby structure level, the setup becomes more interesting.
The important lesson is:
The Hammer is not isolated. It can become one piece of a larger market narrative.
22. Hammer After a Liquidity Sweep
Let’s imagine a previous low exists at ₹200.
Price falls:
₹220 → ₹210 → ₹200
Many traders identify ₹200 as support.
Then price suddenly falls to ₹195.
Stops below ₹200 may get triggered.
But price quickly returns above ₹200.
Then a Hammer forms.
What happened?
The market:
- Traded below the previous low
- Took liquidity
- Rejected lower prices
- Returned above the previous level
- Formed a Hammer
This is a much more interesting setup than a random Hammer in the middle of nowhere.
23. Hammer and Order Blocks
Suppose you identify a bullish order block.
Price later returns to that area.
During the retest, price temporarily moves lower and forms a Hammer.
This may indicate that buyers are defending the zone.
A trader could then look for confirmation such as:
- Break of Hammer high
- Bullish engulfing candle
- Change of character
- Break of structure
- Increased volume
Again, the Hammer becomes a confirmation tool inside a broader framework.
24. Hammer vs Hanging Man
This is extremely important because these two candles can look almost identical.
Hammer
Usually appears after a decline.
Potential bullish reversal signal.
Hanging Man
Usually appears after an advance.
Potential bearish warning.
The physical shape can be very similar.
The difference is largely context.
Remember:
The same candle shape can have different meanings depending on where it appears.
This is one of the most important principles of candlestick analysis.
25. Hammer vs Inverted Hammer
Another commonly confused pattern is the Inverted Hammer.
Hammer
Long lower shadow.
Small body near the top.
Potential bullish reversal after a decline.
Inverted Hammer
Long upper shadow.
Small body near the bottom.
Potential bullish reversal after a decline.
They look different because the rejection occurs on different sides.
The Hammer shows rejection of lower prices.
The Inverted Hammer shows buyers attempted to push price higher but faced selling pressure before the close.
The confirmation requirements also matter.
26. Hammer vs Bullish Pin Bar
Many price-action traders use the term bullish pin bar for a candle that looks very similar to a Hammer.
The terminology can vary between trading systems.
A bullish pin bar generally emphasizes:
- Long lower wick
- Small body
- Rejection of lower prices
A Hammer is specifically a candlestick-pattern classification with a particular contextual interpretation.
In practical trading, there can be substantial overlap between the two.
The important thing is not the label.
The important thing is:
Where did rejection occur?
Why did rejection occur?
Did buyers follow through?
27. How to Identify a Hammer Step by Step
When you are looking at a chart, don’t rush.
Ask yourself these questions.
Step 1: Was there a decline?
Look to the left.
Has price been falling?
If not, be cautious about calling it a Hammer reversal.
Step 2: Is the lower wick significantly larger than the body?
Look at the candle.
Is there clear rejection below?
If the wick is tiny, it may not be a meaningful Hammer.
Step 3: Is the body near the upper portion?
The body should generally be toward the top of the candle.
Step 4: Is the upper wick relatively small?
A very large upper wick can weaken the classic Hammer structure.
Step 5: Where did it form?
Check:
- Support
- Demand zone
- Previous swing low
- Moving average
- Fibonacci level
- Psychological level
- Order block
- Liquidity area
Step 6: What is the volume doing?
Is there increased participation?
Step 7: What happens next?
Does price break above the Hammer?
Does it reject the Hammer?
Does it remain sideways?
This final step is extremely important.
28. A Practical Hammer Trading Setup
Let’s create a hypothetical example.
Suppose a stock is trading at ₹1,000.
The market has been declining.
Price reaches ₹920.
₹920 is a previous support zone.
During the session:
Open = ₹925
High = ₹930
Low = ₹900
Close = ₹928
This creates a Hammer-like candle.
Now we have:
- Previous decline
- Support
- Long lower wick
- Close near the upper part
- Rejection of ₹900
Instead of buying immediately, we wait.
The next day, price trades above:
₹930
This breaks the Hammer high.
Now a possible trade structure could be:
Entry
Above ₹930 after confirmation.
Stop-loss
Below the Hammer low, depending on the strategy and risk management.
For example:
Hammer low = ₹900
A trader might place a stop around ₹898 or another appropriate level, allowing for market volatility.
Target
Potential targets could be:
- Previous swing high
- Resistance zone
- Risk-reward multiple
- Moving average
- Supply zone
The exact target should come from the chart, not from the Hammer itself.
29. Risk-Reward Using a Hammer
Suppose:
Entry = ₹932
Stop-loss = ₹898
Risk = ₹34
If you want a 1:2 risk-reward ratio:
Potential reward = ₹68
Target:
₹932 + ₹68 = ₹1,000
Now you have:
Risk = ₹34
Potential reward = ₹68
Risk:Reward = 1:2
This doesn’t guarantee success.
But it creates a structured trading plan.
30. Position Sizing Is More Important Than the Candle
This is something beginners often overlook.
Suppose your trading capital is ₹1,00,000.
You decide that you will risk only 1% per trade.
Maximum risk:
₹1,00,000 × 1% = ₹1,000
Suppose:
Entry = ₹932
Stop-loss = ₹898
Risk per share:
₹34
Maximum quantity:
₹1,000 ÷ ₹34 ≈ 29 shares
So instead of thinking:
“How many shares can I buy?”
think:
“How much am I willing to lose if I’m wrong?”
That is a professional mindset.
31. Why Stop-Loss Should Often Be Below the Hammer Low
The Hammer low represents the lowest price reached during the rejection.
If you are taking a bullish trade based on that rejection, a break below the Hammer low can invalidate part of your original thesis.
For example:
Hammer low = ₹900
If price subsequently falls below ₹900 and remains there, the idea that buyers strongly defended that level becomes weaker.
Therefore, the Hammer low can become an important reference point.
However, don’t blindly place the stop exactly one tick below the wick.
Market volatility, spreads, and liquidity can cause temporary stop-outs.
Your stop should be based on:
- Market structure
- Volatility
- Position size
- Trading timeframe
- Risk tolerance
32. Don’t Place the Stop Based Only on Candle Size
Imagine one Hammer has a tiny range.
Another Hammer has an enormous range.
Using the exact same stop-loss method for both doesn’t necessarily make sense.
The larger Hammer may require a wider stop.
If you don’t want to increase risk, reduce your position size.
This is a fundamental trading principle:
Adjust position size to risk, not risk to position size.
33. Common Mistake #1: Buying Every Hammer
This is probably the most common mistake.
You open a chart.
You find a Hammer.
You buy.
Then another Hammer appears.
You buy again.
Soon you realize:
Not every Hammer produces a reversal.
Why?
Because candles don’t operate independently of market conditions.
A Hammer during a powerful downtrend can fail.
A Hammer in the middle of consolidation can fail.
A Hammer below major resistance can fail.
A Hammer against a strong bearish market can fail.
The solution?
Stop trading the candle.
Start trading the context.
34. Common Mistake #2: Ignoring the Trend
Suppose the market has been falling aggressively for months.
A Hammer appears.
A beginner says:
“Reversal!”
But the next day price continues falling.
Why?
Because one candle doesn’t automatically reverse a larger trend.
A trend reversal usually requires a process.
For example:
Downtrend
↓
Selling pressure weakens
↓
Support forms
↓
Hammer
↓
Higher low
↓
Break of resistance
↓
Change in structure
↓
Potential uptrend
The Hammer may be an early clue, not the entire reversal.
35. Common Mistake #3: Ignoring Resistance Above
Suppose a Hammer forms at ₹500.
You buy at ₹510.
But major resistance exists at ₹525.
That leaves only ₹15 of upside before a significant obstacle.
If your stop is ₹495, you’re risking ₹15 to potentially make only ₹15.
That’s a 1:1 setup.
The Hammer might be valid, but the trade may not be attractive.
This is why target analysis is essential.
Before entering, ask:
Where is the next major resistance?
36. Common Mistake #4: Entering Before Confirmation
Suppose Hammer high = ₹500.
You buy at ₹480 simply because you expect the Hammer to work.
Price later breaks the Hammer low.
You lose.
Instead, you could wait for price to demonstrate bullish strength.
For example:
Hammer forms.
↓
Price breaks Hammer high.
↓
Entry.
This can reduce some false signals, although it may also result in a higher entry price.
Trading always involves trade-offs.
37. Common Mistake #5: Ignoring Volume
A Hammer formed with strong participation near a major support area can be more meaningful than a Hammer formed with extremely weak activity.
Volume isn’t perfect.
But it can help answer:
“Was there meaningful participation around this rejection?”
Use it as supporting evidence rather than a standalone signal.
38. Common Mistake #6: Using the Hammer on Every Timeframe Without Context
A Hammer on a 1-minute chart and a Hammer on a daily chart are not necessarily equivalent.
The higher timeframe generally contains broader market information.
For example:
A Hammer on a daily chart may represent an entire day’s battle between buyers and sellers.
A Hammer on a 1-minute chart represents only one minute.
This doesn’t mean lower timeframes are useless.
It means you should understand the timeframe you are trading.
39. Multi-Timeframe Hammer Analysis
One useful approach is to combine multiple timeframes.
For example:
Daily chart
Identify the major trend and important support.
1-hour chart
Look for the price approaching that area.
15-minute chart
Look for the Hammer and confirmation.
This gives you:
Higher timeframe context + lower timeframe entry
For example:
Daily:
Bullish support zone.
↓
1-hour:
Price pulls back into support.
↓
15-minute:
Hammer forms.
↓
15-minute:
Hammer high breaks.
This can create a more structured setup.
40. Hammer With Support and Resistance
Let’s create another example.
Imagine the stock has repeatedly bounced from ₹750.
You mark ₹750 as support.
Price eventually falls from:
₹820 → ₹800 → ₹780 → ₹755
Then:
Low = ₹742
But price closes at ₹760.
This creates a lower wick below the ₹750 support level.
Now we have an interesting story:
Price temporarily moved below support.
But buyers recovered price back above support.
That rejection may be significant.
If the next candle breaks the Hammer high and price continues upward, the setup becomes stronger.
41. What If the Hammer Forms Below Support?
This is an interesting situation.
Suppose support is ₹750.
Price drops to ₹735.
Hammer forms.
But the candle closes at ₹740, still below ₹750.
This may be less convincing.
Why?
Because the market has not reclaimed the support level.
Now imagine:
Price drops to ₹735.
Hammer forms.
Close = ₹758.
The market has reclaimed ₹750.
That is more interesting.
Therefore:
Rejection + reclaim
can be more powerful than rejection alone.
42. Hammer and False Breakouts
Sometimes a Hammer can form after a false breakdown.
For example:
Support = ₹1,000
Price breaks down:
₹1,000 → ₹980
Everyone thinks:
“Support has failed.”
But then buyers enter.
Price returns:
₹980 → ₹1,010
A Hammer or strong rejection candle appears.
This could indicate that the breakdown was false.
If price then breaks a nearby resistance level, the setup becomes even more compelling.
43. Hammer at Psychological Levels
Round numbers can sometimes act as important reference points.
Examples:
₹100
₹500
₹1,000
₹5,000
Suppose price falls toward ₹1,000 and forms a Hammer.
If ₹1,000 also corresponds to:
- Previous support
- Demand zone
- Moving average
- Swing low
then the confluence becomes stronger.
Again:
The number itself isn’t magical.
The market’s behavior around the level is what matters.
44. Hammer and Fibonacci Retracement
Some traders use Fibonacci retracement levels to identify potential pullback areas.
Suppose a stock moves:
₹100 → ₹200
Then retraces toward:
38.2%
50%
61.8%
If a Hammer appears around one of these levels and other factors support the trade, it may provide additional confirmation.
But don’t make the mistake of thinking:
“61.8% + Hammer = guaranteed reversal.”
There is no guarantee.
Fibonacci is simply another analytical tool.
45. Hammer in a Strong Downtrend
Let’s discuss one of the most dangerous situations.
Imagine a stock is falling rapidly because of:
- Poor earnings
- Negative news
- Sector weakness
- Broad market crash
- Structural business problems
A Hammer appears.
You think:
“Buy the reversal.”
But the next day:
Another large bearish candle appears.
This happens because the underlying selling pressure remains strong.
Therefore, when the broader market environment is extremely bearish, you should be more selective with bullish reversal patterns.
46. Hammer During a Market Crash
During a crash, you may see many long lower wicks.
Why?
Because volatility becomes extremely high.
Price can fall dramatically during a session and then recover.
That does not necessarily mean the bottom has arrived.
You need additional evidence such as:
- Stabilization
- Higher lows
- Decreasing selling pressure
- Strong support
- Market breadth improvement
- Break of resistance
- Confirmation across timeframes
A Hammer during a crash is a clue.
It is not a guaranteed bottom signal.
47. Hammer in a Sideways Market
Suppose price is moving between:
₹900 support
and
₹1,000 resistance.
Price reaches ₹900.
Hammer forms.
Now the Hammer may have more relevance because it is occurring at the bottom of a range.
But if the same Hammer forms at ₹950 in the middle of the range, its significance may be lower.
This illustrates another important principle:
Location matters.
48. Hammer Near the Bottom of a Range
Consider:
Resistance = ₹1,000
Price oscillates:
₹950
₹980
₹920
₹970
₹910
₹960
Eventually:
₹900
Hammer forms.
If ₹900 is the lower boundary of the range, the rejection could provide a useful bullish clue.
Potential target:
₹1,000 resistance.
But again, price must actually move toward the target.
49. The Strongest Hammer Setup Is Often a Combination
If I were teaching you one-to-one, I would tell you not to search for a magical candle.
Instead, search for confluence.
For example:
Strong Setup
- Price is approaching major support.
- The broader trend is not strongly bearish.
- Price sweeps a previous low.
- Hammer forms.
- Volume increases.
- Hammer closes strongly.
- Next candle breaks Hammer high.
- Market structure begins shifting.
- There is enough room to the next resistance.
- Risk-reward is acceptable.
Now you’re no longer trading a candle.
You’re trading a market situation.
50. A Complete Hammer Strategy
Let’s create a simple educational framework.
Step 1: Identify a Downtrend or Pullback
Look for declining price or a pullback toward support.
Step 2: Mark Important Support
Find:
- Previous swing low
- Demand zone
- Moving average
- Range support
- Fibonacci level
- Order block
- Liquidity area
Step 3: Wait for Hammer
The candle should have:
- Small body
- Long lower wick
- Body near upper part
- Relatively small upper wick
Step 4: Check Volume
Look for meaningful participation.
Step 5: Wait for Confirmation
A common confirmation is a break above the Hammer high.
Step 6: Define Stop-Loss
Consider placing the stop below the Hammer low, adjusted for volatility and market structure.
Step 7: Identify Target
Use:
- Previous resistance
- Swing high
- Supply zone
- Risk-reward multiple
Step 8: Calculate Position Size
Risk a predetermined percentage of capital.
Step 9: Execute
Only take the trade if the complete setup meets your rules.
51. Example Trade
Let’s make this very practical.
Suppose:
Capital = ₹2,00,000
Maximum risk = 1%
Risk allowed = ₹2,000
Stock has been declining.
Support = ₹1,200
Hammer forms:
Open = ₹1,215
High = ₹1,220
Low = ₹1,180
Close = ₹1,218
Next day:
Price breaks ₹1,220.
Possible entry:
₹1,222
Suppose stop:
₹1,178
Risk per share:
₹1,222 − ₹1,178 = ₹44
Maximum quantity:
₹2,000 ÷ ₹44 ≈ 45 shares
So you might consider approximately 45 shares under this simplified risk model.
Potential risk:
45 × ₹44 = ₹1,980
Now suppose the next major resistance is ₹1,310.
Potential reward:
₹1,310 − ₹1,222 = ₹88
Reward:risk:
₹88 ÷ ₹44 = 2
So approximately:
1:2 risk-reward
This is a structured trade.
52. What If the Hammer Fails?
Every good trading strategy must explain failure.
Suppose you enter above Hammer high.
Price initially rises.
Then suddenly falls.
Eventually:
Price < Hammer low.
Your setup has failed.
Don’t move the stop lower simply because you don’t want to take the loss.
This is where trading psychology becomes important.
A trader might think:
“Maybe it will recover.”
Then:
₹1,178 → ₹1,160 → ₹1,140
The small planned loss becomes a large loss.
Therefore:
A failed setup is part of trading.
The goal isn’t to avoid every losing trade.
The goal is to control the size of losing trades.
53. Failed Hammer Can Also Be Useful Information
This is an advanced concept.
Suppose a Hammer forms at major support.
You expect buyers.
But price breaks below the Hammer low with strong momentum.
What does that tell you?
It tells you that buyers failed to defend the area.
That failure itself can provide information about market strength.
Sometimes failed bullish setups can become bearish continuation setups.
This is why you should observe what the market actually does rather than forcing your prediction.
54. Hammer and Trading Psychology
Trading isn’t just chart analysis.
It’s also psychology.
When you see a Hammer, you may feel:
“This is the bottom!”
That emotional reaction can cause premature entry.
Instead, train yourself to think:
“Interesting rejection. Let’s see whether buyers can prove themselves.”
That small change in mindset can significantly improve discipline.
You move from:
Prediction
to
Confirmation.
55. The Professional Mindset
A beginner asks:
“Will this Hammer work?”
A professional trader asks:
“What evidence supports this setup, where is the invalidation point, and what is my risk if I’m wrong?”
That’s a completely different approach.
No candlestick pattern can predict the future with certainty.
Candlestick analysis is about interpreting probabilities and market behavior.
56. Hammer With Risk Management
Even a high-quality setup can fail.
Suppose your strategy has a 55% win rate.
You can still have:
- 4 losses in a row
- 5 losses in a row
- Losing weeks
- Losing months
If your risk per trade is too large, a small losing streak can damage your capital.
Therefore, your Hammer strategy should always include:
Entry
Stop-loss
Position size
Target
Maximum risk
Exit rules
Without these, you’re not really following a strategy.
You’re simply reacting to candles.
57. Hammer and Risk-Reward
You don’t need to win every trade.
Suppose you risk:
₹1,000
to potentially make:
₹2,000.
If you lose:
−₹1,000
If you win:
+₹2,000
Even with some losing trades, the positive risk-reward structure can potentially make the strategy viable if the win rate and execution are favorable.
For example:
10 trades
5 wins × ₹2,000 = ₹10,000
5 losses × ₹1,000 = −₹5,000
Net:
₹5,000
This is only a mathematical illustration, not a promise of profitability.
Real trading includes slippage, brokerage, taxes, execution issues, and changing market conditions.
58. Hammer on Different Timeframes
Let’s compare.
1-minute Hammer
Useful for very short-term trading.
More market noise.
5-minute Hammer
Useful for intraday setups.
15-minute Hammer
Can provide cleaner intraday structure.
1-hour Hammer
More significant swing within the session.
Daily Hammer
Often more meaningful for positional analysis.
Weekly Hammer
Can indicate rejection of a major longer-term level.
The higher the timeframe, the larger the market context represented by the candle.
But higher timeframe does not mean guaranteed success.
59. How I Would Teach You to Read a Hammer
If we were sitting together looking at a chart, I would tell you:
Don’t look at the Hammer first.
First, look left.
Ask:
What has price been doing?
Is it:
- Rising?
- Falling?
- Sideways?
Then ask:
Where is price now?
Is it at:
- Support?
- Resistance?
- Demand?
- Supply?
- Previous high?
- Previous low?
Then look at the Hammer.
Ask:
What happened during this candle?
Then look at the next candle.
Ask:
Did buyers follow through?
This sequence is far more powerful than memorizing a candle shape.
60. The Story of a Hammer in One Sentence
If I had to explain the Hammer in the simplest possible way, I would say:
“Sellers pushed the price down, but buyers rejected those lower prices and brought the market back toward the top of the candle.”
That’s the entire psychological story.
61. A Simple Checklist Before Trading a Hammer
Before taking a Hammer-based trade, ask:
Market Context
☐ Has price recently declined?
☐ Is the market at an important area?
☐ Is the broader trend supportive?
Candle Structure
☐ Is the lower wick clearly long?
☐ Is the body relatively small?
☐ Is the body near the upper part?
☐ Is the upper wick relatively small?
Confirmation
☐ Did price break the Hammer high?
☐ Is there bullish follow-through?
Confluence
☐ Is there support?
☐ Is there a demand zone?
☐ Is volume supportive?
☐ Is there a liquidity sweep?
☐ Is there a moving-average reaction?
Risk Management
☐ Where is the stop?
☐ Where is the target?
☐ What is the risk-reward?
☐ How much capital am I risking?
If several answers are unfavorable, there may be no reason to take the trade.
62. When NOT to Trade a Hammer
This is just as important as knowing when to trade it.
Avoid blindly trading a Hammer when:
1. It appears in the middle of nowhere
No meaningful support or context.
2. The broader trend is extremely bearish
Especially if there is strong fundamental or market-wide selling pressure.
3. Major resistance is immediately above
There may not be enough upside.
4. The candle has poor structure
Extremely large body or unusual wick configuration.
5. There is no confirmation
If your strategy requires confirmation, don’t skip it.
6. Risk-reward is poor
Even a good pattern may not make a good trade.
7. You are trading emotionally
Never enter simply because the candle “looks good.”
63. Hammer and Supply/Demand
Let’s go deeper.
Suppose price falls into a demand zone.
The zone has previously generated a strong rally.
When price returns, sellers initially dominate.
Price moves below the zone.
Then buyers aggressively reclaim it.
A Hammer forms.
Now the Hammer provides visual evidence of rejection.
The demand zone provides location.
The previous rally provides context.
Volume may provide participation.
The next candle provides confirmation.
This is exactly what confluence-based trading looks like.
64. Hammer and Liquidity
Price often moves toward areas where many traders have placed stops.
Imagine a previous low at ₹500.
Many traders who bought near ₹500 may place stops below ₹500.
Price falls to ₹495.
Stops trigger.
Then price reverses to ₹515.
A Hammer-like rejection can appear.
This can indicate that price temporarily moved below the obvious low before reversing.
Again, don’t automatically assume every wick is a liquidity sweep.
You need actual market structure and price behavior to support that interpretation.
65. Hammer and Break of Structure
Suppose the market is bearish:
Lower High
↓
Lower Low
↓
Lower High
↓
Lower Low
Then a Hammer forms at a major demand zone.
Price rallies.
Instead of stopping at the previous lower high, it breaks above it.
Now the market may be showing a structural shift.
The Hammer didn’t create the entire reversal.
It was an early clue within the sequence.
This is an important advanced concept:
Candlestick → Reaction → Structure
rather than:
Candlestick → Guaranteed reversal
66. Hammer and Change of Character
If you’re using Smart Money Concepts, you might look for a Change of Character after the Hammer.
For example:
Downtrend
↓
Liquidity sweep
↓
Hammer
↓
Strong bullish move
↓
Previous short-term high breaks
↓
Potential CHoCH
This can provide stronger confirmation than simply buying the Hammer.
67. Hammer and Fair Value Gap
Suppose a Hammer forms after a liquidity sweep.
Price then rallies aggressively and leaves a bullish Fair Value Gap.
A trader may use:
Hammer = initial reversal clue
Liquidity sweep = context
FVG = evidence of aggressive displacement
Structure break = confirmation
Retest = potential entry opportunity
This is a more advanced way to incorporate candlestick behavior into a broader trading system.
68. Why the Location of the Wick Matters
A long wick doesn’t simply tell you that price moved.
It tells you where price was rejected.
Suppose a Hammer’s low occurs exactly at:
- Previous swing low
- Demand zone
- Major support
That makes the wick more meaningful.
The market is essentially saying:
“We explored this lower price area, but buyers rejected it.”
That is why the location of the wick matters.
69. Hammer and Closing Price
The closing price is extremely important.
Suppose the candle has a long lower wick.
But the close is near the middle of the candle.
The recovery was incomplete.
Now suppose the close is near the high.
Buyers recovered much more strongly.
Therefore, all else equal, a strong close near the top can provide stronger bullish evidence.
70. Hammer With a Bullish Next Candle
Let’s compare two situations.
Situation A
Hammer forms.
Next candle is a small indecision candle.
There is no strong follow-through.
Situation B
Hammer forms.
Next candle is a strong bullish candle that breaks the Hammer high.
Situation B generally provides stronger confirmation.
This is why some traders wait for the next candle rather than entering immediately.
71. Aggressive vs Conservative Hammer Entry
There are different approaches.
Aggressive Entry
Enter near the Hammer close or during the Hammer formation after identifying rejection.
Advantage
Better entry price.
Disadvantage
Higher chance of entering before confirmation.
Conservative Entry
Wait for a break above the Hammer high.
Advantage
More confirmation.
Disadvantage
Entry may be at a higher price.
Neither approach is universally correct.
The choice depends on your strategy, timeframe, and risk management.
72. Another Practical Example
Let’s say:
Stock price:
₹650
Trend:
Downward.
Support:
₹600.
Price falls to:
₹605.
During the session:
Low = ₹595
Close = ₹612
Hammer forms.
Next day:
High = ₹620
Previous Hammer high = ₹615.
Price breaks ₹615.
A trader following a confirmation strategy could consider the breakout.
Stop might be based around the Hammer low.
Target could be:
₹640
or
₹650
depending on the chart.
Now ask yourself:
Why is this better than buying simply because the Hammer appeared?
Because you’re getting:
Location + Rejection + Confirmation.
73. Hammer Does Not Predict the Exact Target
Another common misconception is:
“Hammer means price will rise 5%, 10%, or 20%.”
No.
The Hammer does not tell you the exact target.
Your target comes from:
- Market structure
- Resistance
- Supply zones
- Previous highs
- Volatility
- Risk-reward framework
The candle mainly gives you information about rejection and potential directional change.
74. Hammer and Price Action
Candlestick patterns are essentially a language of price action.
Think of the Hammer as saying:
“The market explored lower prices but rejected them.”
A bearish engulfing candle may say:
“Sellers overwhelmed buyers.”
A Doji may say:
“The market is uncertain.”
A strong bullish candle may say:
“Buyers dominated this period.”
When you combine these candles into sequences, you begin to read the market like a story.
75. Don’t Memorize Candles Without Understanding Them
You can memorize:
Hammer
Doji
Engulfing
Morning Star
Shooting Star
Marubozu
Harami
and dozens of other patterns.
But if you don’t understand market psychology, the names won’t make you a better trader.
Instead, ask:
Who was winning initially?
Who took control later?
Where did the battle occur?
Was the area important?
Did the next candle confirm the move?
This is much more valuable.
76. The Hammer Is a Story of a Battle
Think of every candlestick as a small battle.
At the beginning:
Sellers may dominate.
During the session:
Price falls.
Then:
Buyers enter.
They push price back up.
The final closing price records the result of that battle.
The long lower wick is the evidence of the battle that happened below.
That’s why candlestick analysis is so powerful.
You’re not simply reading shapes.
You’re reading market behavior.
77. Five Things That Make a Hammer More Interesting
If you want to remember a simple framework, remember these five:
1. Downtrend or Pullback
The market has declined.
2. Important Location
The Hammer forms at meaningful support/demand.
3. Clear Rejection
Long lower wick.
4. Strong Confirmation
Price breaks the Hammer high or otherwise shows bullish follow-through.
5. Good Risk-Reward
There is enough room toward the target.
If these five conditions align, the Hammer deserves much more attention.
78. Five Things That Make a Hammer Weak
On the other hand:
1. No meaningful decline
It appears randomly.
2. No important level
No support or demand.
3. Weak structure
Poor-quality candle.
4. No follow-through
Price immediately falls again.
5. Poor risk-reward
Resistance is too close.
In such situations, simply seeing a Hammer shouldn’t convince you to trade.
79. The Biggest Lesson
If you’re learning candlestick patterns, please don’t make the mistake of thinking:
Pattern = Prediction
Instead think:
Pattern = Information
The Hammer gives you information.
It tells you:
Lower prices were rejected.
Then you decide whether that information is important based on:
- Context
- Location
- Trend
- Volume
- Structure
- Confirmation
- Risk-reward
That’s a much more professional approach.
80. Final Summary
Let’s bring everything together.
A Hammer Candlestick Pattern is generally characterized by:
- A small real body
- A long lower shadow
- A relatively small upper shadow
- The body positioned near the top of the candle
- Appearance after a decline or near an important support area
The psychology is simple:
Sellers pushed price down.
↓
Price reached lower levels.
↓
Buyers entered.
↓
Lower prices were rejected.
↓
Price recovered toward the upper part of the candle.
That creates the Hammer.
But remember:
A Hammer Is Not a Guaranteed Buy Signal.
The most important question isn’t:
“Did I find a Hammer?”
The better question is:
“Why did this Hammer form here, and what is the market doing after it?”
Look for confluence.
Look for:
- Support
- Demand
- Previous swing lows
- Liquidity sweeps
- Moving averages
- Volume
- Market structure
- Bullish confirmation
- Risk-reward
And most importantly, manage risk.
Because even the best-looking Hammer can fail.
Hammer Candlestick Pattern: One-Line Definition
If I had to explain the entire concept to a beginner in one sentence, I would say:
A Hammer is a candlestick that shows strong rejection of lower prices and can indicate a potential bullish reversal when it appears after a decline and is supported by the right market context and confirmation.
The Golden Rule of the Hammer
And finally, remember this rule:
Don’t trade the Hammer. Trade the story behind the Hammer.
The candle is only the visible result.
The real information is hidden inside the price movement:
Selling → Lower Prices → Rejection → Buying → Recovery → Confirmation
Once you start seeing that story instead of simply seeing a candle shape, your understanding of candlestick patterns changes completely.
And that is when candlestick analysis starts becoming price-action analysis, rather than simple pattern memorization.

Gaurav Heera is an Indian finance analyst, investor, and financial educator with a passion for making the stock market simple and accessible for everyone. As the founder of Asset Scholars, he has dedicated his career to helping beginners and aspiring investors understand the world of investing through practical, easy-to-understand financial education.