
Doji Candlestick Pattern: The Complete Guide to Understanding and Trading Doji
Introduction
Let us talk about one of the most famous and misunderstood candlestick patterns in technical analysis:
The Doji Candlestick Pattern
If you have ever looked at a price chart, you have probably seen a candle that looks almost like a plus sign.
It has a very small body—or sometimes almost no body at all.
It may have an upper wick, a lower wick, or both.
That is a Doji.
At first glance, Doji looks very simple.
But there is a much deeper story behind it.
Many beginners learn one simple rule:
“Doji means reversal.”
This is one of the biggest mistakes you can make.
A Doji does not automatically mean that the market will reverse.
The primary message of a Doji is:
The market is showing indecision or balance between buyers and sellers.
Whether that indecision eventually leads to:
- a reversal,
- a continuation,
- consolidation,
- or simply more sideways movement
depends on the market context.
That context includes:
- The trend
- Support and resistance
- Volume
- Market structure
- Price location
- Previous candles
- The size of the wicks
- The next candle
- Liquidity
- Momentum
- Timeframe
So today, instead of simply memorizing the shape of a Doji, we are going to understand what is happening inside the market when a Doji forms.
1. What Is a Candlestick?
Before understanding Doji, we need to understand what a candlestick actually represents.
A candlestick represents price movement during a specific period of time.
For example:
- A 1-minute candle represents 1 minute.
- A 5-minute candle represents 5 minutes.
- A 15-minute candle represents 15 minutes.
- A 1-hour candle represents 1 hour.
- A daily candle represents one trading day.
- A weekly candle represents one trading week.
Every candlestick has four primary prices:
Open
The price at which the candle begins.
High
The highest price reached during that period.
Low
The lowest price reached during that period.
Close
The price at which the candle finishes.
These four prices create the shape of the candlestick.
2. How Does a Doji Form?
A Doji forms when:
The opening price and closing price are the same or very close to each other.
Let’s take a simple example.
Suppose a stock opens at:
$100
During the session, buyers push the price to:
$108
Then sellers become aggressive and push it down to:
$95
Later, buyers return and the price recovers.
The candle finally closes at:
$100.20
What happened?
The market moved significantly in both directions.
But after all that movement, the closing price ended up very close to the opening price.
Therefore:
Open ≈ Close
The result is a Doji.
3. The Psychology Behind a Doji
This is the most important part.
A Doji is not important simply because of its shape.
It is important because of what the shape tells us about the battle between buyers and sellers.
Imagine that a stock opens at $100.
Buyers push it to $108.
That tells us buyers were strong enough to move price upward.
Then sellers enter.
They push price down to $95.
That tells us sellers were also strong.
Eventually, price returns to around $100.
So who won?
Neither side achieved a clear victory.
Buyers pushed price up.
Sellers pushed price down.
The market eventually returned close to where it started.
This creates:
Open ≈ Close
And therefore:
Doji
This is why a Doji is often interpreted as:
A temporary balance or indecision between buyers and sellers.
4. Doji Does NOT Automatically Mean Reversal
Let’s address the biggest misconception.
Suppose a stock is in a strong uptrend.
You see a Doji.
You think:
“The Doji means the market will reverse.”
So you immediately sell.
But the next candle is strongly bullish.
The stock continues higher.
Why did the trade fail?
Because the Doji never promised a reversal.
It only showed:
There was some hesitation or temporary balance between buyers and sellers.
The buyers could still regain control.
Therefore:
Doji is a warning signal, not a guaranteed reversal signal.
This distinction is extremely important.
5. Think of a Doji as a Question Mark
Here is a very simple way to understand it.
Think of a Doji as a question mark (?).
The Doji is asking:
“What happens next?”
It is not giving you the answer.
The next price action may provide that answer.
For example:
Doji + Strong Bullish Candle
Buyers may still be in control.
Doji + Strong Bearish Candle
Sellers may be gaining control.
Doji + More Dojis
Indecision may continue.
Doji + Breakout
The market may continue in the breakout direction.
Therefore:
The Doji creates a question. Price action provides the answer.
6. The Structure of a Doji
A typical Doji has:
- A very small body
- Open and close very close together
- An upper wick
- A lower wick
A simplified structure looks like this:
        High
          |
          |
        ───
          |
          |
         Low
The body is extremely small.
But the wicks can tell us something about what happened during the trading period.
This is why different types of Doji can have slightly different interpretations.
7. Major Types of Doji
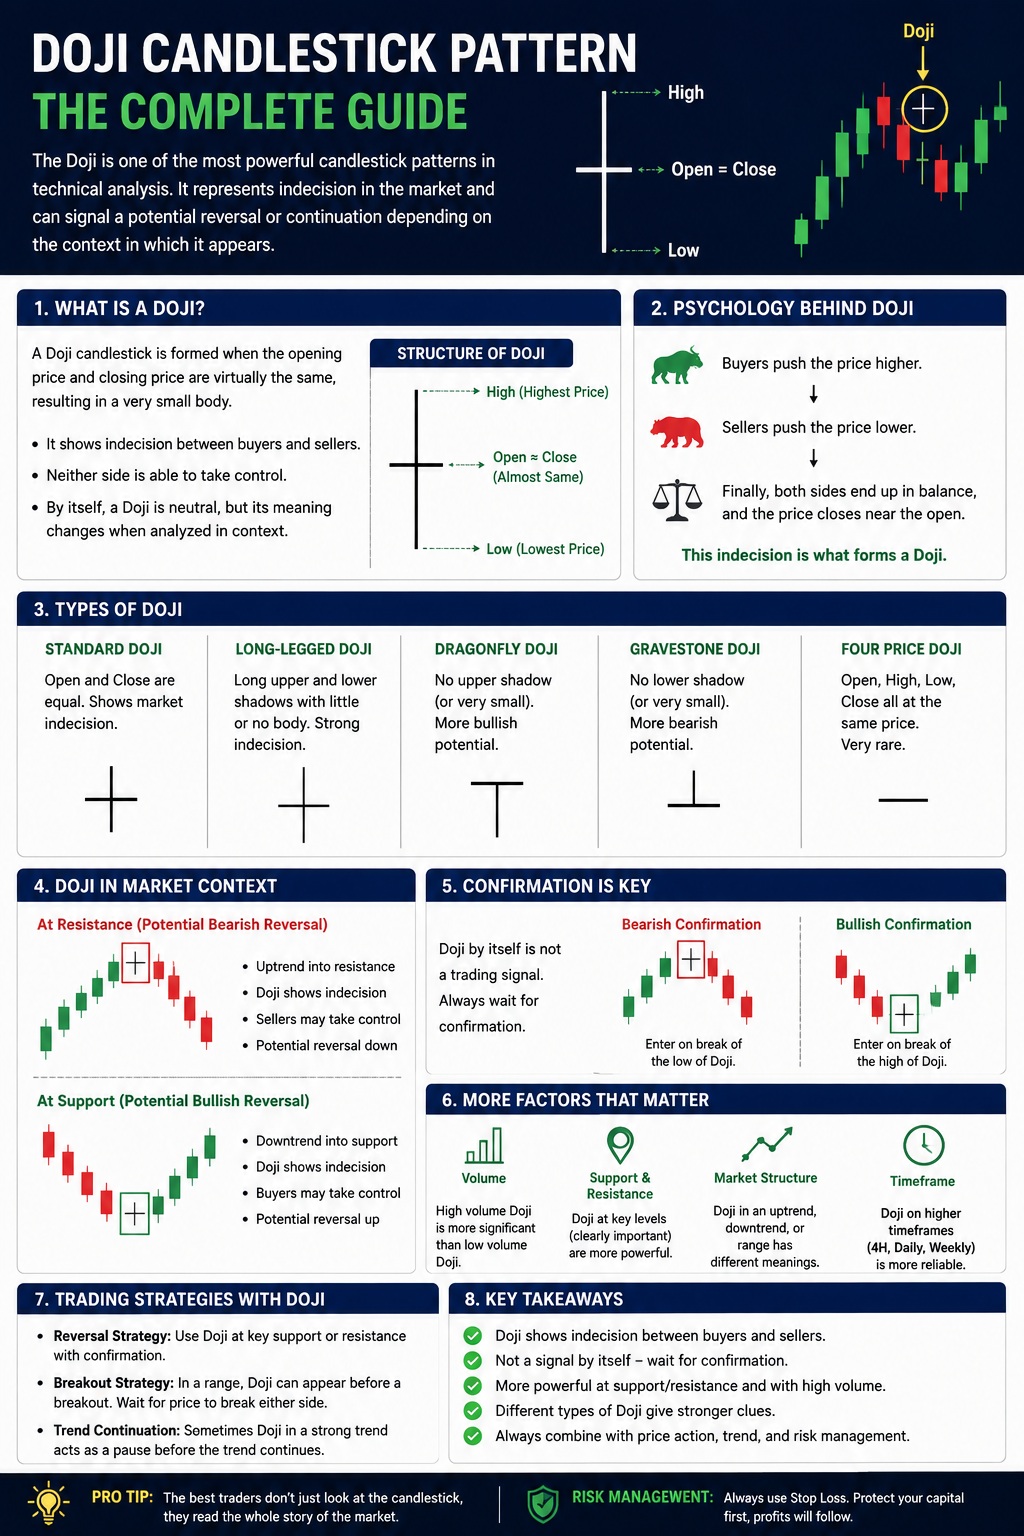
There are several variations of the Doji pattern.
The most important ones are:
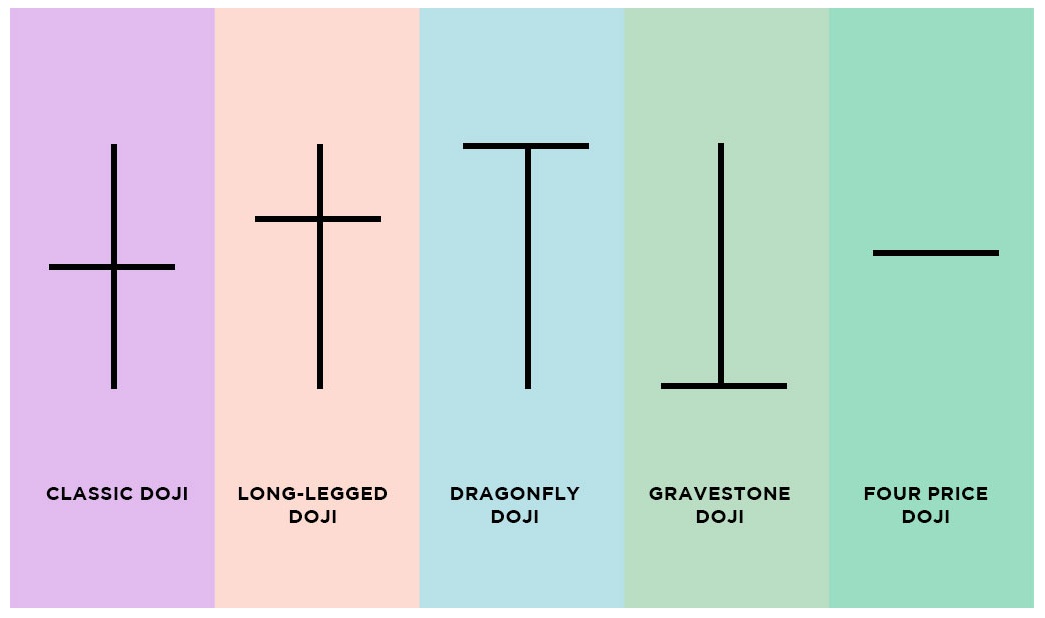
- Standard Doji
- Long-Legged Doji
- Dragonfly Doji
- Gravestone Doji
- Four-Price Doji
Let’s understand each one.
8. Standard Doji
The Standard Doji is the basic form.
It generally has:
- A very small body
- An upper wick
- A lower wick
- Open and close near the same level
The basic structure looks like:
        |
        |
       ───
        |
        |
The primary message is:
Indecision.
The market moved in both directions, but neither buyers nor sellers were able to maintain control by the close.
9. Long-Legged Doji
A Long-Legged Doji has relatively long upper and lower wicks.
For example:
        |
        |
        |
       ───
        |
        |
        |
This tells us that price traveled significantly in both directions.
Imagine:
Open = $100
High = $115
Low = $80
Close = $100
That is a huge range.
Buyers pushed aggressively upward.
Sellers pushed aggressively downward.
Yet the market ended almost exactly where it started.
This can indicate a significant battle between buyers and sellers.
However, remember:
A Long-Legged Doji does not automatically mean reversal.
Its significance depends heavily on where it appears.
10. Dragonfly Doji
A Dragonfly Doji generally resembles the letter:
T
It has:
- Open near the high
- Close near the high
- Long lower wick
- Little or no upper wick
Conceptually:
      ─────
         |
         |
         |
         |
What happened?
The market moved significantly lower.
But buyers stepped in and pushed the price back upward.
The candle eventually closed near the high.
Psychology
Initially:
Sellers were in control.
Later:
Buyers took control.
This is why the Dragonfly Doji can be particularly interesting near support.
But again:
Confirmation is important.
11. Gravestone Doji
The Gravestone Doji is essentially the opposite structure.
It generally has:
- Open near the low
- Close near the low
- Long upper wick
- Little or no lower wick
Conceptually:
         |
         |
         |
         |
      ─────
What happened?
Buyers pushed price significantly higher.
But sellers entered at those higher levels.
They pushed price back down.
The candle eventually closed near the opening/low area.
Psychology
Buyers attempted to take control.
Sellers rejected higher prices.
This can be particularly meaningful near resistance.
12. Four-Price Doji
The Four-Price Doji is a very rare pattern.
In an idealized form:
Open = High = Low = Close
The market essentially trades around the same price throughout the period.
It indicates extremely limited price movement.
This is uncommon in highly liquid markets but can occur in certain market conditions or less liquid instruments.
13. The Most Important Rule About Doji
If you remember only one thing from this entire article, remember this:
The location of the Doji matters more than the Doji itself.
The same Doji can have completely different meanings depending on where it appears.
A Doji:
- In the middle of a range
- At major support
- At major resistance
- After a strong rally
- After a strong decline
- Near a liquidity level
- Near a major breakout
can provide very different information.
14. Doji in an Uptrend
Imagine a stock is making:
Higher High
Higher Low
Higher High
Higher Low
Higher High
The market is clearly trending upward.
Then a Doji appears.
Should you immediately sell?
No.
Instead, ask:
- Is there major resistance nearby?
- Is the market overextended?
- Did the Doji reject higher prices?
- Is volume unusually high?
- What does the next candle do?
- Does market structure change?
- Does price break a previous higher low?
If none of these provide bearish confirmation, the Doji may simply represent temporary hesitation.
15. Doji in a Downtrend
Now imagine the opposite.
The market is making:
Lower Low
Lower High
Lower Low
Lower High
Lower Low
Then a Doji appears.
Does that mean the market is now bullish?
Again:
No.
The Doji may simply mean that sellers have temporarily slowed down.
You need additional evidence.
For example:
- Major support
- Strong lower wick
- Bullish confirmation
- Higher high
- Break of previous lower high
- Increased buying volume
The more evidence that aligns, the more meaningful the setup may become.
16. Doji at Support
Now we are getting into practical trading.
Suppose a stock has a strong support zone around:
$80
Price falls:
$100 → $95 → $90 → $85 → $80
At $80, a Doji forms.
The price temporarily falls to $77.
But buyers enter.
Price returns to $80.
The candle closes around $80.
What does this tell us?
Sellers were able to push price below the support area.
But they couldn’t maintain control.
Buyers responded.
This makes the Doji more interesting.
But still:
Wait for confirmation.
If the next candle is strongly bullish, the bullish interpretation becomes stronger.
17. Doji at Resistance
Now consider resistance.
Suppose resistance is at:
$120
Price rises:
$100 → $105 → $110 → $115 → $120
Price moves to $125.
But sellers enter aggressively.
Price falls back toward $120.
The candle closes near its opening price.
A Doji forms.
Now we have:
Resistance + Higher Price Rejection + Doji
This is much more interesting than a random Doji in the middle of a range.
If the next candle is strongly bearish, the setup becomes stronger.
18. Doji + Support/Resistance
For beginners, this is one of the easiest ways to start understanding Doji.
Instead of asking:
“Wherever I see a Doji, should I trade?”
Ask:
“Is the Doji appearing at an important price level?”
Examples:
Doji + Support
Potential bullish setup.
Doji + Resistance
Potential bearish setup.
But remember:
These are possibilities, not guarantees.
19. Doji and Volume
Now let’s add another important factor:
Volume
Suppose a stock normally trades 1 million shares per day.
At a major resistance level, a Doji forms.
But today’s volume is 3 million shares.
That tells us there was unusually high participation.
A significant amount of trading occurred, yet price still closed near the opening level.
This can indicate a strong battle between buyers and sellers.
However, volume should not be interpreted in isolation.
Always combine it with price structure and location.
20. High-Volume Doji
A high-volume Doji at a major market level can be more significant than a low-volume Doji.
For example:
Scenario A
Doji + low volume + middle of range
Potentially low significance.
Scenario B
Doji + high volume + major resistance
Potentially more significant.
The difference is context.
21. Low-Volume Doji
A Doji formed during very low trading activity may simply reflect a lack of participation.
For example:
- Midday trading
- Low-liquidity market
- Quiet session
- Narrow trading range
The market may simply not have enough participation to create a strong directional move.
Therefore:
Not every Doji represents an important battle.
22. Doji + Next Candle
This is one of the most important practical concepts.
After a Doji forms:
Watch what happens next.
Suppose a Doji appears at resistance.
Scenario 1
Next candle is strongly bearish.
This supports the bearish interpretation.
Scenario 2
Next candle is strongly bullish.
This weakens the bearish interpretation.
Scenario 3
Another Doji forms.
The market remains undecided.
Therefore:
Doji + Confirmation is generally more useful than Doji alone.
23. Doji + Break of Structure
Now let’s move into advanced price action.
Suppose the market is in an uptrend:
HH → HL → HH → HL → HH
Price reaches resistance.
A Doji forms.
Then price breaks below the previous higher low.
Now we have:
Doji + Structure Break
The Doji showed hesitation.
The structure break provides additional evidence that market behavior may be changing.
This is much more meaningful than simply seeing a Doji.
24. Doji + CHoCH
If you use Smart Money Concepts, you may also look for:
CHoCH — Change of Character
Suppose the market is trending upward.
A Doji appears at a major resistance level.
Then price breaks an important higher low.
This may indicate a change in market behavior.
The Doji itself did not cause the reversal.
Instead:
Doji = Warning
CHoCH = Additional Confirmation
This distinction is very important.
25. Doji + Order Block
Suppose price enters a bullish Order Block.
Inside that zone, a Dragonfly Doji forms.
The next candle becomes strongly bullish.
Now you have:
Order Block
Doji
Bullish Confirmation
This is stronger than simply seeing a Doji anywhere on the chart.
The same logic can be applied to a bearish Order Block.
26. Doji + Liquidity Sweep
Let’s take an advanced example.
Suppose a previous high is:
$500
Price approaches the level.
Then moves above it:
$505
$510
But fails to sustain those higher prices.
A Doji forms.
The candle has a long upper wick.
Then the next candle becomes strongly bearish.
This could represent:
- A sweep of previous highs
- Rejection of higher prices
- Doji formation
- Bearish confirmation
This is a much stronger market story than:
“There was a Doji, so I sold.”
27. Doji in a Range-Bound Market
Now let’s look at a common situation.
Suppose a stock is moving sideways between:
Support = $90
Resistance = $100
Price keeps moving:
90 → 95 → 100 → 95 → 90 → 96 → 100
Now a Doji forms at:
$95
which is the middle of the range.
Should you immediately trade?
Probably not.
Why?
Because the Doji is not occurring at an important boundary.
It is simply forming in the middle of the range.
But if a Doji forms around $100 resistance, it becomes more interesting.
If it forms around $90 support, it also becomes more interesting.
Again:
Location matters.
28. Doji After a Strong Rally
Consider this move:
$100
↓
$110
↓
$120
↓
$130
↓
$140
↓
$150
↓
$160
Then a Doji forms around $160.
This may indicate:
- hesitation
- profit-taking
- reduced momentum
- possible exhaustion
But it does not guarantee reversal.
The market could simply pause before continuing higher.
Therefore, wait for confirmation.
29. Doji After a Strong Decline
Now the opposite:
$160
↓
$150
↓
$140
↓
$130
↓
$120
↓
$110
↓
$100
At $100, a Doji forms.
This may indicate:
- selling pressure is slowing
- buyers are becoming active
- potential exhaustion
- possible support
If $100 is also a major support zone and the next candle becomes strongly bullish, the setup becomes more interesting.
30. Doji and Exhaustion
Doji can sometimes appear near the end of extended trends.
Why?
Because after a long trend, the dominant side may begin to lose momentum.
For example:
After a long rally:
Buyers may become less aggressive.
Sellers may start appearing.
The result can be temporary balance.
That balance may produce a Doji.
But to identify actual exhaustion, we should look for additional evidence:
- Extended trend
- Major resistance
- High volume
- Long rejection wick
- Failed breakout
- Momentum weakening
- Structure break
A Doji alone is not enough.
31. Doji vs Spinning Top
Beginners sometimes confuse Doji and Spinning Top.
They are related because both can represent uncertainty.
But technically they are different.
Doji
Open and close are almost identical.
Spinning Top
The body is small, but there is still a noticeable difference between open and close.
Both can indicate hesitation.
But a Doji represents a more extreme case where the opening and closing prices are almost the same.
32. Doji vs Hammer
A Hammer generally has:
- Small body
- Long lower wick
- Small or limited upper wick
A Doji has:
- Open ≈ Close
If the candle has a very long lower wick and its open and close are almost identical, it may resemble a Dragonfly Doji.
The important thing is not simply the name.
Ask:
What happened to price during the candle?
That gives you the real information.
33. Doji vs Gravestone
A Gravestone Doji has:
- Long upper wick
- Very small body
- Open and close near the low
It shows that buyers pushed price higher but could not maintain those higher levels.
This becomes particularly interesting near resistance.
34. The Biggest Strength of a Doji
The biggest strength of a Doji is:
It tells you to pay attention.
Think of a traffic light.
When the light turns yellow, it doesn’t necessarily mean:
“Stop immediately.”
It means:
“Pay attention. Something may be changing.”
A Doji works similarly.
It tells you:
“Something is happening here. Watch the next price action.”
35. The Biggest Weakness of a Doji
The biggest weakness is:
False signals.
Doji candles occur frequently.
If you trade every Doji, you may experience:
- Overtrading
- False entries
- Frequent stop losses
- Emotional decisions
- Poor risk management
Therefore, the goal isn’t to find more Doji candles.
The goal is to find:
High-quality Doji setups.
36. How to Identify a High-Quality Doji
A higher-quality Doji setup may have several factors aligned.
Factor 1 — Important Location
Support, resistance, previous high, previous low, liquidity zone, etc.
Factor 2 — Clear Trend
The market has a recognizable directional structure.
Factor 3 — Meaningful Rejection
The wick shows rejection from an important price.
Factor 4 — Volume
Volume supports the significance of the move.
Factor 5 — Confirmation
The next candle confirms the expected direction.
Factor 6 — Market Structure
The structure supports the interpretation.
Factor 7 — Risk-Reward
There is a logical trade opportunity.
The more independent factors align, the stronger the overall setup may become.
37. A Simple Bullish Doji Trading Framework
Let’s create a basic framework.
Step 1 — Find Support
Identify an important support zone.
Step 2 — Wait for Price
Allow price to approach the zone.
Step 3 — Look for Doji
Wait for a Doji or a rejection-type Doji.
Step 4 — Study the Wick
Look for evidence that lower prices were rejected.
Step 5 — Wait for Confirmation
Do not rush.
Wait for bullish price action.
Step 6 — Consider Entry
An entry can be considered according to your trading plan after confirmation.
Step 7 — Define Stop Loss
The stop should be placed at a logical invalidation level.
Step 8 — Define Target
Target can be based on:
- Resistance
- Previous swing high
- Market structure
- Risk-reward
38. A Simple Bearish Doji Trading Framework
Now the opposite.
Step 1
Identify major resistance.
Step 2
Wait for price to reach the zone.
Step 3
Look for Doji formation.
Step 4
Study the upper wick.
Is higher price being rejected?
Step 5
Wait for bearish confirmation.
Step 6
Consider entry according to your trading plan.
Step 7
Place the stop at a logical invalidation level.
Step 8
Target the next logical support or swing low.
39. Where Should the Stop Loss Be?
Never place your stop randomly.
Your stop should be connected to the reason for the trade.
For a bearish Doji setup near resistance:
Suppose:
Resistance = $500
Doji high = $505
If price breaks strongly above that area and sustains above it, your bearish thesis may become invalid.
Therefore, the stop should be based on the structure and volatility of the setup.
Similarly, for a bullish Doji near support:
Support = $450
Doji low = $445
If price decisively breaks below the support structure, the bullish idea may become invalid.
The exact stop placement depends on your strategy and timeframe.
40. Risk-Reward
Suppose:
Entry = $500
Stop Loss = $490
Risk = $10
Target = $530
Potential reward = $30
Risk-reward ratio:
1:3
This means you are risking $1 to potentially make $3.
However, don’t choose unrealistic targets simply to create an attractive risk-reward ratio.
Your target should make sense according to market structure.
41. Common Mistakes When Trading Doji
Mistake 1: Assuming Every Doji Means Reversal
Wrong.
Doji primarily indicates indecision.
Mistake 2: Entering Without Confirmation
Seeing Doji and immediately entering a trade.
This can create unnecessary losses.
Mistake 3: Ignoring Location
A Doji in the middle of a range is not necessarily important.
Mistake 4: Ignoring the Trend
Shorting a strong bullish trend simply because a Doji appeared.
Dangerous.
Mistake 5: Ignoring Volume
Volume can provide useful information about participation.
Mistake 6: Ignoring Timeframe
A Doji on a 1-minute chart is not automatically as significant as a Doji on a daily chart.
Mistake 7: Overtrading
Trading every Doji you see.
Mistake 8: No Defined Risk
Thinking:
“It is a Doji, so price must reverse.”
That is not risk management.
42. Professional Interpretation of a Doji
A beginner asks:
“There is a Doji. Should I buy or sell?”
A more experienced trader asks:
“Where did the Doji form?”
Then:
“What was the trend before the Doji?”
Then:
“What happened during the candle?”
Then:
“Who rejected whom?”
Then:
“What does volume tell me?”
Then:
“What does the next candle do?”
Then:
“Did market structure change?”
And finally:
“Where is my invalidation level and is the risk worth taking?”
This is the difference between pattern recognition and market analysis.
43. A Complete Example
Let’s build a hypothetical example.
A stock is in a strong uptrend.
Price moves:
$100 → $110 → $120 → $130 → $140
There is major resistance around $140.
Price moves slightly above resistance to:
$145
But sellers enter.
Price falls toward:
$138
The candle eventually closes around:
$140
A Doji forms with an upper wick.
Now let’s analyze.
Observation 1
The Doji is at major resistance.
Good.
Observation 2
Price moved above resistance but failed to hold.
Interesting.
Observation 3
The upper wick shows rejection.
Interesting.
Observation 4
A Doji indicates indecision.
Important.
Now the next candle becomes strongly bearish.
Observation 5
Bearish confirmation.
Then price breaks a short-term swing low.
Observation 6
Market structure confirms the bearish idea.
Notice what happened.
We did not sell simply because we saw a Doji.
We waited for the story to develop.
44. A Bullish Example
Now let’s look at the opposite.
A stock is falling:
$500 → $480 → $460 → $440 → $420
There is strong historical support around $420.
Price falls briefly to:
$410
Buyers enter aggressively.
Price recovers.
The candle closes near $420.
A Dragonfly Doji forms.
The next candle becomes strongly bullish.
Then price breaks the previous short-term high.
Now we have:
Support
Lower-price rejection
Dragonfly Doji
Bullish confirmation
Structure break
This is a much stronger bullish story than simply:
“I saw a Doji.”
45. Doji and Psychology
Trading is ultimately driven by human behavior.
There are two major emotional forces:
Greed
The desire to buy because prices may rise.
Fear
The desire to sell because prices may fall.
During a strong trend, one side generally dominates.
But eventually, there can be moments where the dominant side loses some confidence.
Buyers hesitate.
Sellers become more active.
Or sellers hesitate while buyers begin to appear.
That temporary balance can produce a Doji.
This is why Doji is such an interesting candlestick pattern.
It gives us a visual representation of market uncertainty.
46. Doji Does Not Predict the Future
This principle is extremely important.
Candlestick patterns do not predict the future with certainty.
They summarize what happened during a specific period.
A Doji tells us:
“During this period, buyers and sellers ended close to balance.”
It does not know what the next candle will do.
The next candle could be:
- Bullish
- Bearish
- Another Doji
- A breakout
- A fakeout
Therefore, successful trading is not about certainty.
It is about:
Probability + Risk Management
47. Doji and Probability
Suppose you backtest a particular setup:
Support + Doji + Bullish Confirmation
You test 200 historical trades.
You discover that the setup produced profitable results in 120 trades.
That’s a 60% win rate.
Does that mean your next trade will definitely win?
No.
It simply means the historical setup showed a statistical edge under those tested conditions.
This is how systematic trading should be approached.
48. Backtesting a Doji Strategy
If you want to build a Doji-based strategy, don’t rely only on visual impressions.
Backtest it.
For example:
Strategy
- 15-minute chart
- Major support/resistance
- Doji formation
- Confirmation candle
- Entry after confirmation
- Stop beyond logical invalidation
- Target at 2R
Then test 100–200+ historical examples.
Record:
- Number of trades
- Winning trades
- Losing trades
- Win rate
- Average winner
- Average loser
- Maximum drawdown
- Maximum losing streak
- Risk-reward
- Market conditions
This will tell you whether your strategy actually has an edge.
49. Filters for a Doji Strategy
You can add additional filters to improve selectivity.
Trend Filter
Only trade in the direction of the higher timeframe trend.
Level Filter
Only trade Doji near significant levels.
Volume Filter
Require meaningful volume.
Structure Filter
Require a break of a relevant swing.
Momentum Filter
Use indicators such as RSI or MACD if they are part of your system.
Session Filter
For intraday trading, restrict setups to specific market sessions if your testing supports it.
The purpose of filters is not to make a strategy look complicated.
The purpose is to remove low-quality setups.
50. Doji in Intraday Trading
Intraday traders can watch Doji around:
- Previous Day High
- Previous Day Low
- Major Support
- Major Resistance
- VWAP
- Opening Range
- Day High
- Day Low
- Breakout Zones
- Liquidity Levels
However, random Doji candles in the middle of a range often have less significance.
51. Doji in Swing Trading
Swing traders can use daily and weekly Doji patterns.
Suppose a stock has been falling toward major weekly support.
A daily Doji forms.
The next day produces a strong bullish candle.
The weekly structure remains supportive.
Volume increases.
Now the Doji becomes part of a larger swing-trading story.
This is much more useful than simply scanning for Doji candles without context.
52. Doji in Options Trading
Options traders can also use Doji as part of their analysis of the underlying asset.
For example:
NIFTY approaches major resistance.
A Gravestone Doji forms.
The next candle confirms bearish price action.
A trader with an already-defined bearish options strategy may consider a put-side setup.
But remember:
Options have additional variables such as:
- Time decay
- Implied volatility
- Strike selection
- Liquidity
- Expiration
- Theta
- Gamma
Therefore:
Doji should never be the only reason for taking an options trade.
53. Doji and Smart Money Concepts
If you use Smart Money Concepts, you can combine Doji with concepts such as:
- Liquidity Sweep
- Order Block
- Fair Value Gap
- BOS
- CHoCH
- Premium/Discount
- Liquidity Pools
For example:
Liquidity Sweep
↓
Doji
↓
Rejection
↓
CHoCH
↓
Entry
Here the Doji acts as an additional confirmation layer.
Another example:
Order Block
↓
Price enters zone
↓
Doji forms
↓
Strong displacement
↓
Structure shift
Again, the Doji is not the complete strategy.
It is one piece of the puzzle.
54. Doji and Liquidity
Let’s imagine a previous high at:
$1,000
Price approaches:
$980
$990
$1,000
Then pushes to:
$1,020
Many traders may have stop orders around the previous high.
Price moves above the old high, but then quickly falls back.
A Doji forms.
The next candle becomes strongly bearish.
This can potentially represent:
- Liquidity sweep
- Failed breakout
- Rejection
- Doji
- Bearish confirmation
This is a much richer market story than simply identifying a candle pattern.
55. Doji and Moving Averages
Doji can also be used with moving averages.
Suppose a stock is in an uptrend.
Price pulls back toward the:
20 EMA
At the 20 EMA, a Doji forms.
The next candle becomes strongly bullish.
Now we have:
Uptrend
Dynamic support
Doji
Bullish confirmation
This can potentially create a stronger continuation setup.
But again, always test the rules before assuming they work.
56. Doji and RSI
RSI can provide additional context.
Suppose price reaches major resistance.
A Doji forms.
RSI is in an elevated zone.
The next candle is bearish.
This may strengthen the bearish hypothesis.
But don’t make the mistake of thinking:
“RSI is overbought, therefore price must fall.”
Strong trends can remain overbought for long periods.
Therefore:
RSI + Doji + Price Structure
is more useful than RSI alone.
57. Doji and Engulfing Candles
One useful confirmation pattern is an engulfing candle.
For example:
Resistance
↓
Doji
↓
Bearish Engulfing
This provides:
Indecision + Bearish Confirmation
Similarly:
Support
↓
Doji
↓
Bullish Engulfing
provides:
Indecision + Bullish Confirmation
Again, context remains essential.
58. Doji and Gap
Sometimes a Doji forms after a significant gap.
For example:
Previous close:
$100
Next session opens:
$108
Price moves to:
$112
Then falls to:
$105
Finally closes around:
$108
The resulting candle may have Doji-like characteristics.
Here, the gap itself provides additional information.
The Doji tells us that despite the strong opening displacement, buyers and sellers eventually reached temporary balance.
Therefore:
Gap + Doji
should be analyzed as a complete price-action story.
59. The Professional Way to Read a Doji
When you see a Doji, don’t immediately ask:
“Buy or sell?”
Instead, ask these questions.
Question 1
Where did it form?
Question 2
What was the trend before it?
Question 3
What happened during the candle?
Question 4
What do the wicks tell me?
Question 5
Was there unusual volume?
Question 6
Is there support or resistance nearby?
Question 7
Was liquidity taken?
Question 8
What is the next candle doing?
Question 9
Did market structure change?
Question 10
Where is my invalidation level?
This is how you move from simply recognizing candlestick patterns to actually reading price action.
60. The Doji Trading Formula
You can remember the entire concept using this simple formula:
Doji + Location + Context + Confirmation + Risk Management
Let’s break it down.
Doji
Shows indecision.
Location
Tells you whether the indecision is occurring at an important level.
Context
Tells you what the broader market is doing.
Confirmation
Tells you which side may be gaining control.
Risk Management
Protects you if your interpretation is wrong.
Without risk management, even a very good setup can become a bad trade.
61. Doji Checklist
Before considering a Doji-based trade, ask:
Market Context
☐ Is the market trending or ranging?
☐ What is the higher timeframe trend?
Location
☐ Is the Doji at support?
☐ Is it at resistance?
☐ Is it near a previous high or low?
☐ Is liquidity nearby?
Candle
☐ Is the body extremely small?
☐ How long are the wicks?
☐ What price rejection occurred?
Volume
☐ Is volume normal?
☐ Is volume unusually high?
Confirmation
☐ What does the next candle do?
☐ Is there a breakout?
☐ Is there a structure break?
Risk
☐ Where is the logical stop?
☐ Where is the target?
☐ Is the risk-reward reasonable?
If most of these questions have logical answers, you have a much better basis for analyzing the setup.
62. Ten Golden Rules of the Doji
Let’s summarize everything.
Rule 1
Doji means indecision—not guaranteed reversal.
Rule 2
Location matters.
Rule 3
Trend matters.
Rule 4
The wick tells a story.
Rule 5
Volume can add important context.
Rule 6
Wait for confirmation.
Rule 7
Market structure matters.
Rule 8
Doji in the middle of a range may be less meaningful.
Rule 9
Never trade without predefined risk.
Rule 10
Never assume a candlestick pattern guarantees the next move.
63. The Real Meaning of a Doji
Now let’s bring everything together.
A Doji is not simply:
“A candle with a small body.”
It represents a market situation.
During that period:
Buyers pushed price.
Sellers pushed price.
Price moved.
Price was rejected.
Both sides fought for control.
But ultimately:
Open ≈ Close
That is the story of a Doji.
And this is why the Doji can be so valuable.
It gives you information about market hesitation.
But the information becomes useful only when you combine it with context.
64. The Difference Between a Beginner and an Advanced Trader
A beginner sees:
Doji
An intermediate trader sees:
Doji at resistance
An advanced trader sees:
Doji at resistance after an extended rally with high volume and rejection
A price-action trader sees:
Doji + rejection + structure
An SMC trader may see:
Liquidity sweep + Doji + CHoCH
A systematic trader sees:
A specific setup that can be tested statistically.
That is the evolution of technical analysis.
65. Final Lesson
The most important lesson from this entire article is simple:
Do not trade the Doji. Trade the story behind the Doji.
If the Doji appears randomly in the middle of a range, it may not mean much.
If it appears at major resistance after a long rally, it becomes more interesting.
If it also shows rejection, the story becomes stronger.
If volume is unusually high, another piece of information appears.
If the next candle confirms the rejection, the setup becomes stronger.
If market structure then breaks, you have additional confirmation.
And if the trade also provides a logical risk-reward opportunity, then you may have a complete trading setup.
The Doji itself is only one part of the story.
Conclusion
The Doji is one of the simplest candlestick patterns to recognize, but one of the most important patterns to understand correctly.
At the beginner level:
Doji = Indecision
At the intermediate level:
Doji = Temporary balance between buyers and sellers
At the advanced level:
Doji = Information about hesitation, rejection, volatility and potential change in market behavior
And at the professional level:
A Doji is not a trade signal by itself. It is information that must be interpreted within context.
So the next time you see a Doji on your chart, don’t immediately think:
“Buy or Sell?”
Stop for a moment.
Look left.
Look at the trend.
Look at support and resistance.
Look at the wicks.
Look at volume.
Look at liquidity.
Look at market structure.
Then watch the next candle.
And ask yourself one simple question:
“What is the market trying to tell me through this Doji?”
That question will take you much further than simply memorizing candlestick patterns.
Because successful technical analysis is not about memorizing shapes.
It is about understanding the story behind price.

Gaurav Heera is an Indian finance analyst, investor, and financial educator with a passion for making the stock market simple and accessible for everyone. As the founder of Asset Scholars, he has dedicated his career to helping beginners and aspiring investors understand the world of investing through practical, easy-to-understand financial education.